


中国农业科技导报 ›› 2022, Vol. 24 ›› Issue (5): 145-156.DOI: 10.13304/j.nykjdb.2021.0082
• 生物制造 资源生态 • 上一篇
秦志昊1( ), 王伟1,2(), 肖薇1,2, 胡凝1,2(), 张弥1,2, 赵佳玉1, 谢成玉1
收稿日期:2021-01-25
接受日期:2021-06-01
出版日期:2022-05-15
发布日期:2022-06-06
通讯作者:
王伟,胡凝
作者简介:秦志昊 E-mail:qzhihao.live@outlook.com
基金资助:
Zhihao QIN1(), Wei WANG1,2(), Wei XIAO1,2, Ning HU1,2(), Mi ZHANG1,2, Jiayu ZHAO1, Chengyu XIE1
Received:2021-01-25
Accepted:2021-06-01
Online:2022-05-15
Published:2022-06-06
Contact:
Wei WANG,Ning HU
摘要:
为明确小型水体上的大气湍流特征和涡度相关系统的适用性,基于2018年安徽省滁州市全椒县官渡村小型农业养殖塘的通量观测数据,分析该地的大气稳定状态、湍流方差相似性、湍流速度谱和协谱、湍流强度及湍流动能的变化特征。结果表明,该小型农业养殖塘上1 d内约21 h大气处于不稳定状态;Monin-Obukhov相似理论适用于该农业养殖塘;三维风速归一化标准差随大气稳定度的变化符合1/3次方规律,不稳定条件下的拟合效果优于稳定条件下,且以垂直方向上拟合效果最佳,温度和湿度的归一化标准差在大气不稳定时符合-1/3次方规律;三维风速的湍流谱在惯性子区中符合-2/3次方关系,垂直风速与标量的协谱在惯性子区中符合-4/3次方规律,涡度相关系统能够观测该小型农业养殖塘上的感热、潜热和CO2通量;该小型农业养殖塘上的湍流强度随风速衰减的速度快于大型湖泊,风速大于1 m·s-1时湍流强度趋近于常数,且水平方向上的湍流强度大于垂直方向;该小型农业养殖塘上的湍流动能在中性条件下最大(3.0 m2·s-2),且以风切变贡献为主;湍流动能随风速增大而增大,并呈现昼高夜低的变化特征。上述结果可为明确小型水体上的大气湍流特征及小型农业养殖塘与大气之间能量和物质的交换机制奠定一定的理论基础。
中图分类号:
秦志昊, 王伟, 肖薇, 胡凝, 张弥, 赵佳玉, 谢成玉. 小型农业养殖塘上大气湍流特征的观测分析[J]. 中国农业科技导报, 2022, 24(5): 145-156.
Zhihao QIN, Wei WANG, Wei XIAO, Ning HU, Mi ZHANG, Jiayu ZHAO, Chengyu XIE. Observation Analysis on Atmospheric Turbulence Characteristics Over A Small Fish Pond[J]. Journal of Agricultural Science and Technology, 2022, 24(5): 145-156.
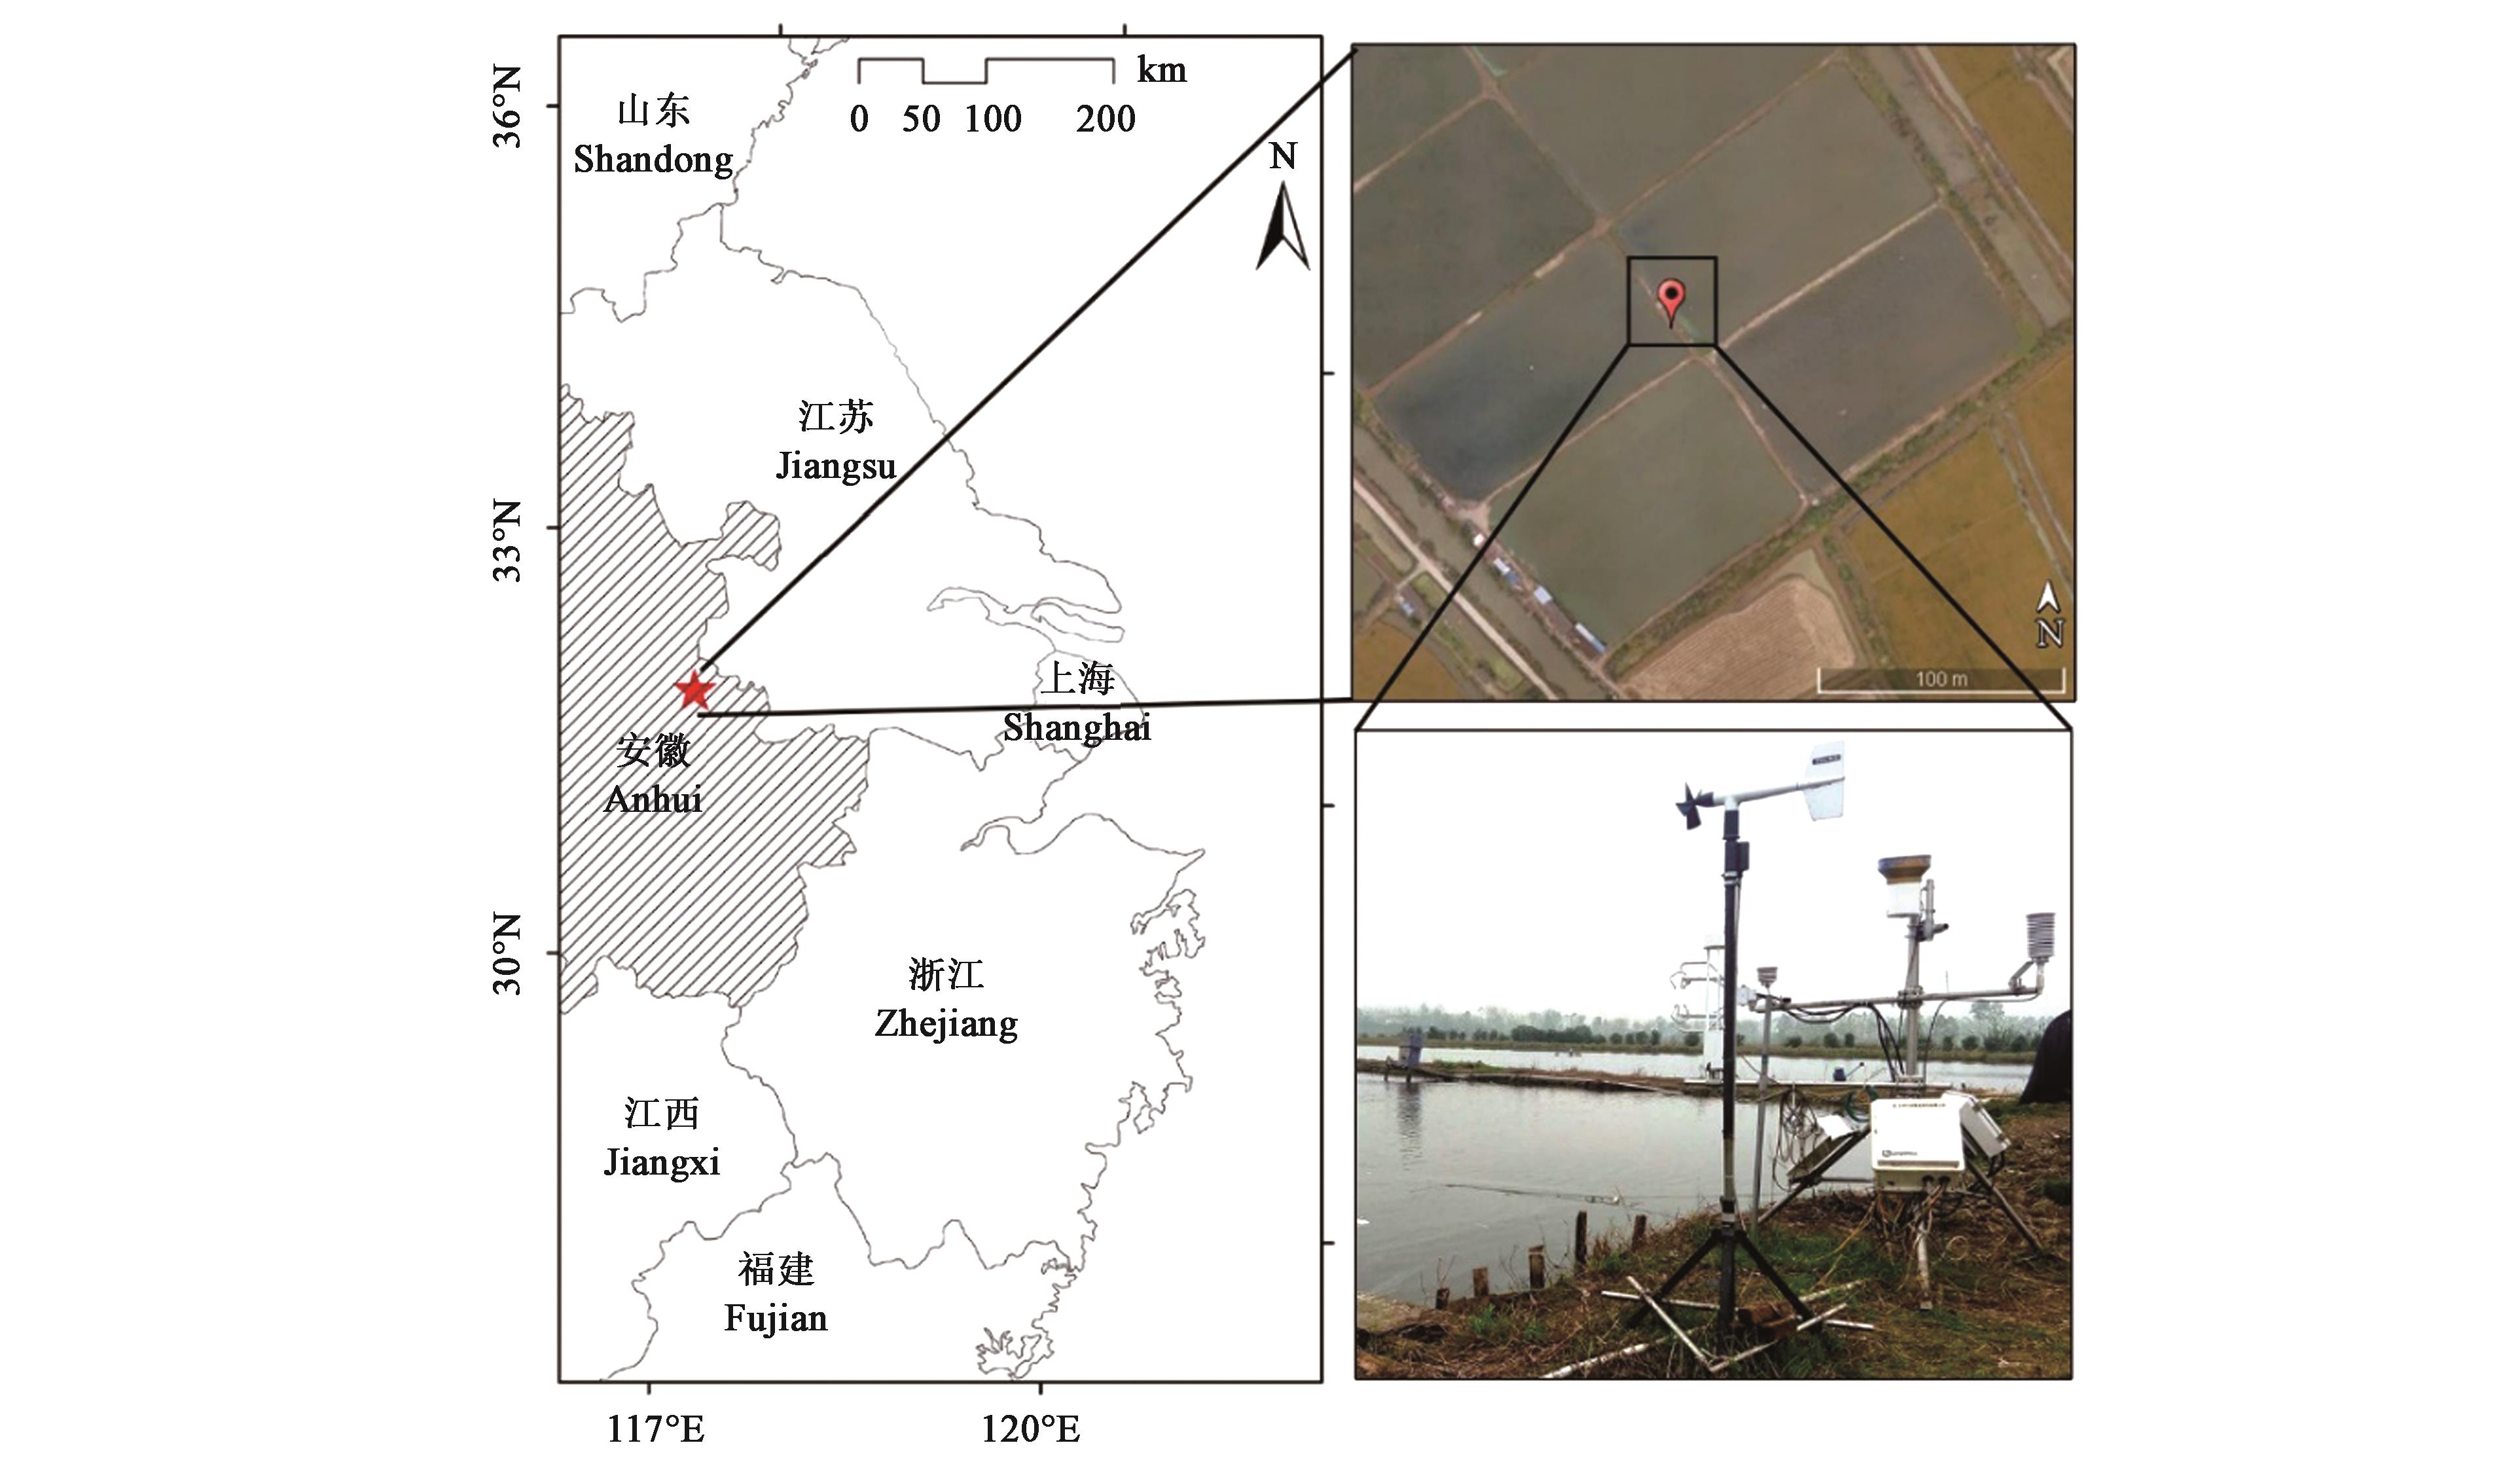
图1 研究区域位置与观测系统注:左图以红星表示观测站点位置,右上图红点标记处为涡度相关系统的安装位置,右下图为涡度相关系统观测的实景照片。
Fig.1 Location of research area and the observation systemNote:The red star on the left figure represents the location of observation station, the red dot on the top right figure represents the location of eddy covariance system, and the figure on the bottom right represents the realpicture of the eddy covariance system observation.
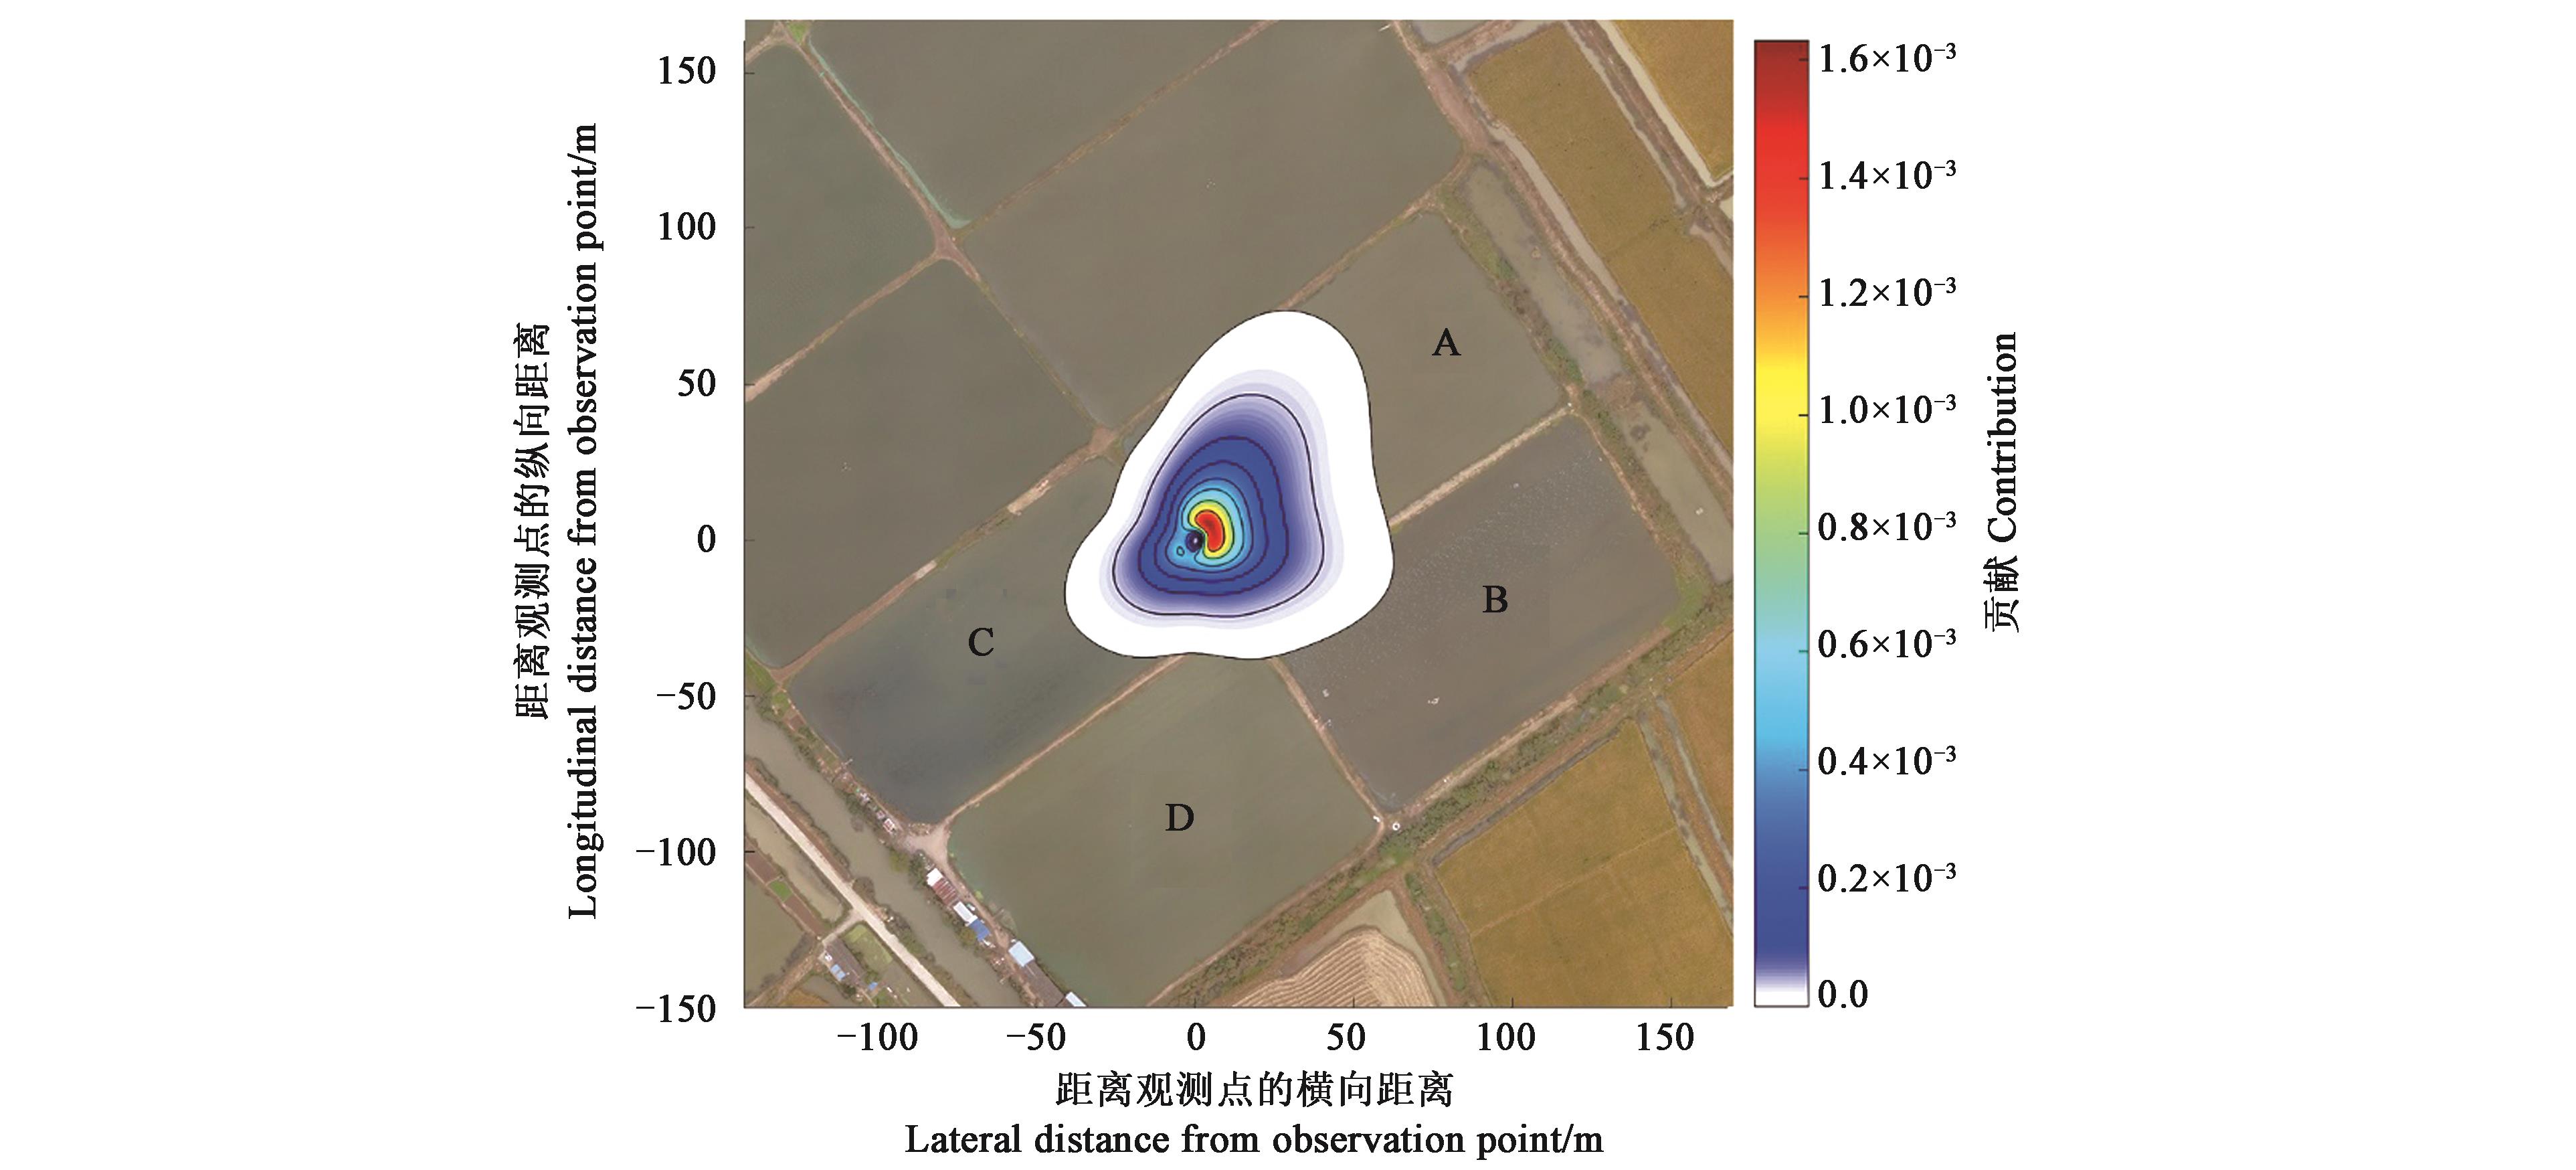
图2 2018年涡度相关观测的通量贡献源区范围注:不同颜色表示每个点对涡度相关观测值的贡献率;A、B、C、D分别为观测点周围的4个农业养殖塘。
Fig.2 Flux footprint area of eddy covariance system in 2018Note: Different color indicates the contribution of each point to eddy covariance observation. A, B, C and D represent 4 fish ponds around the eddy covariance system.
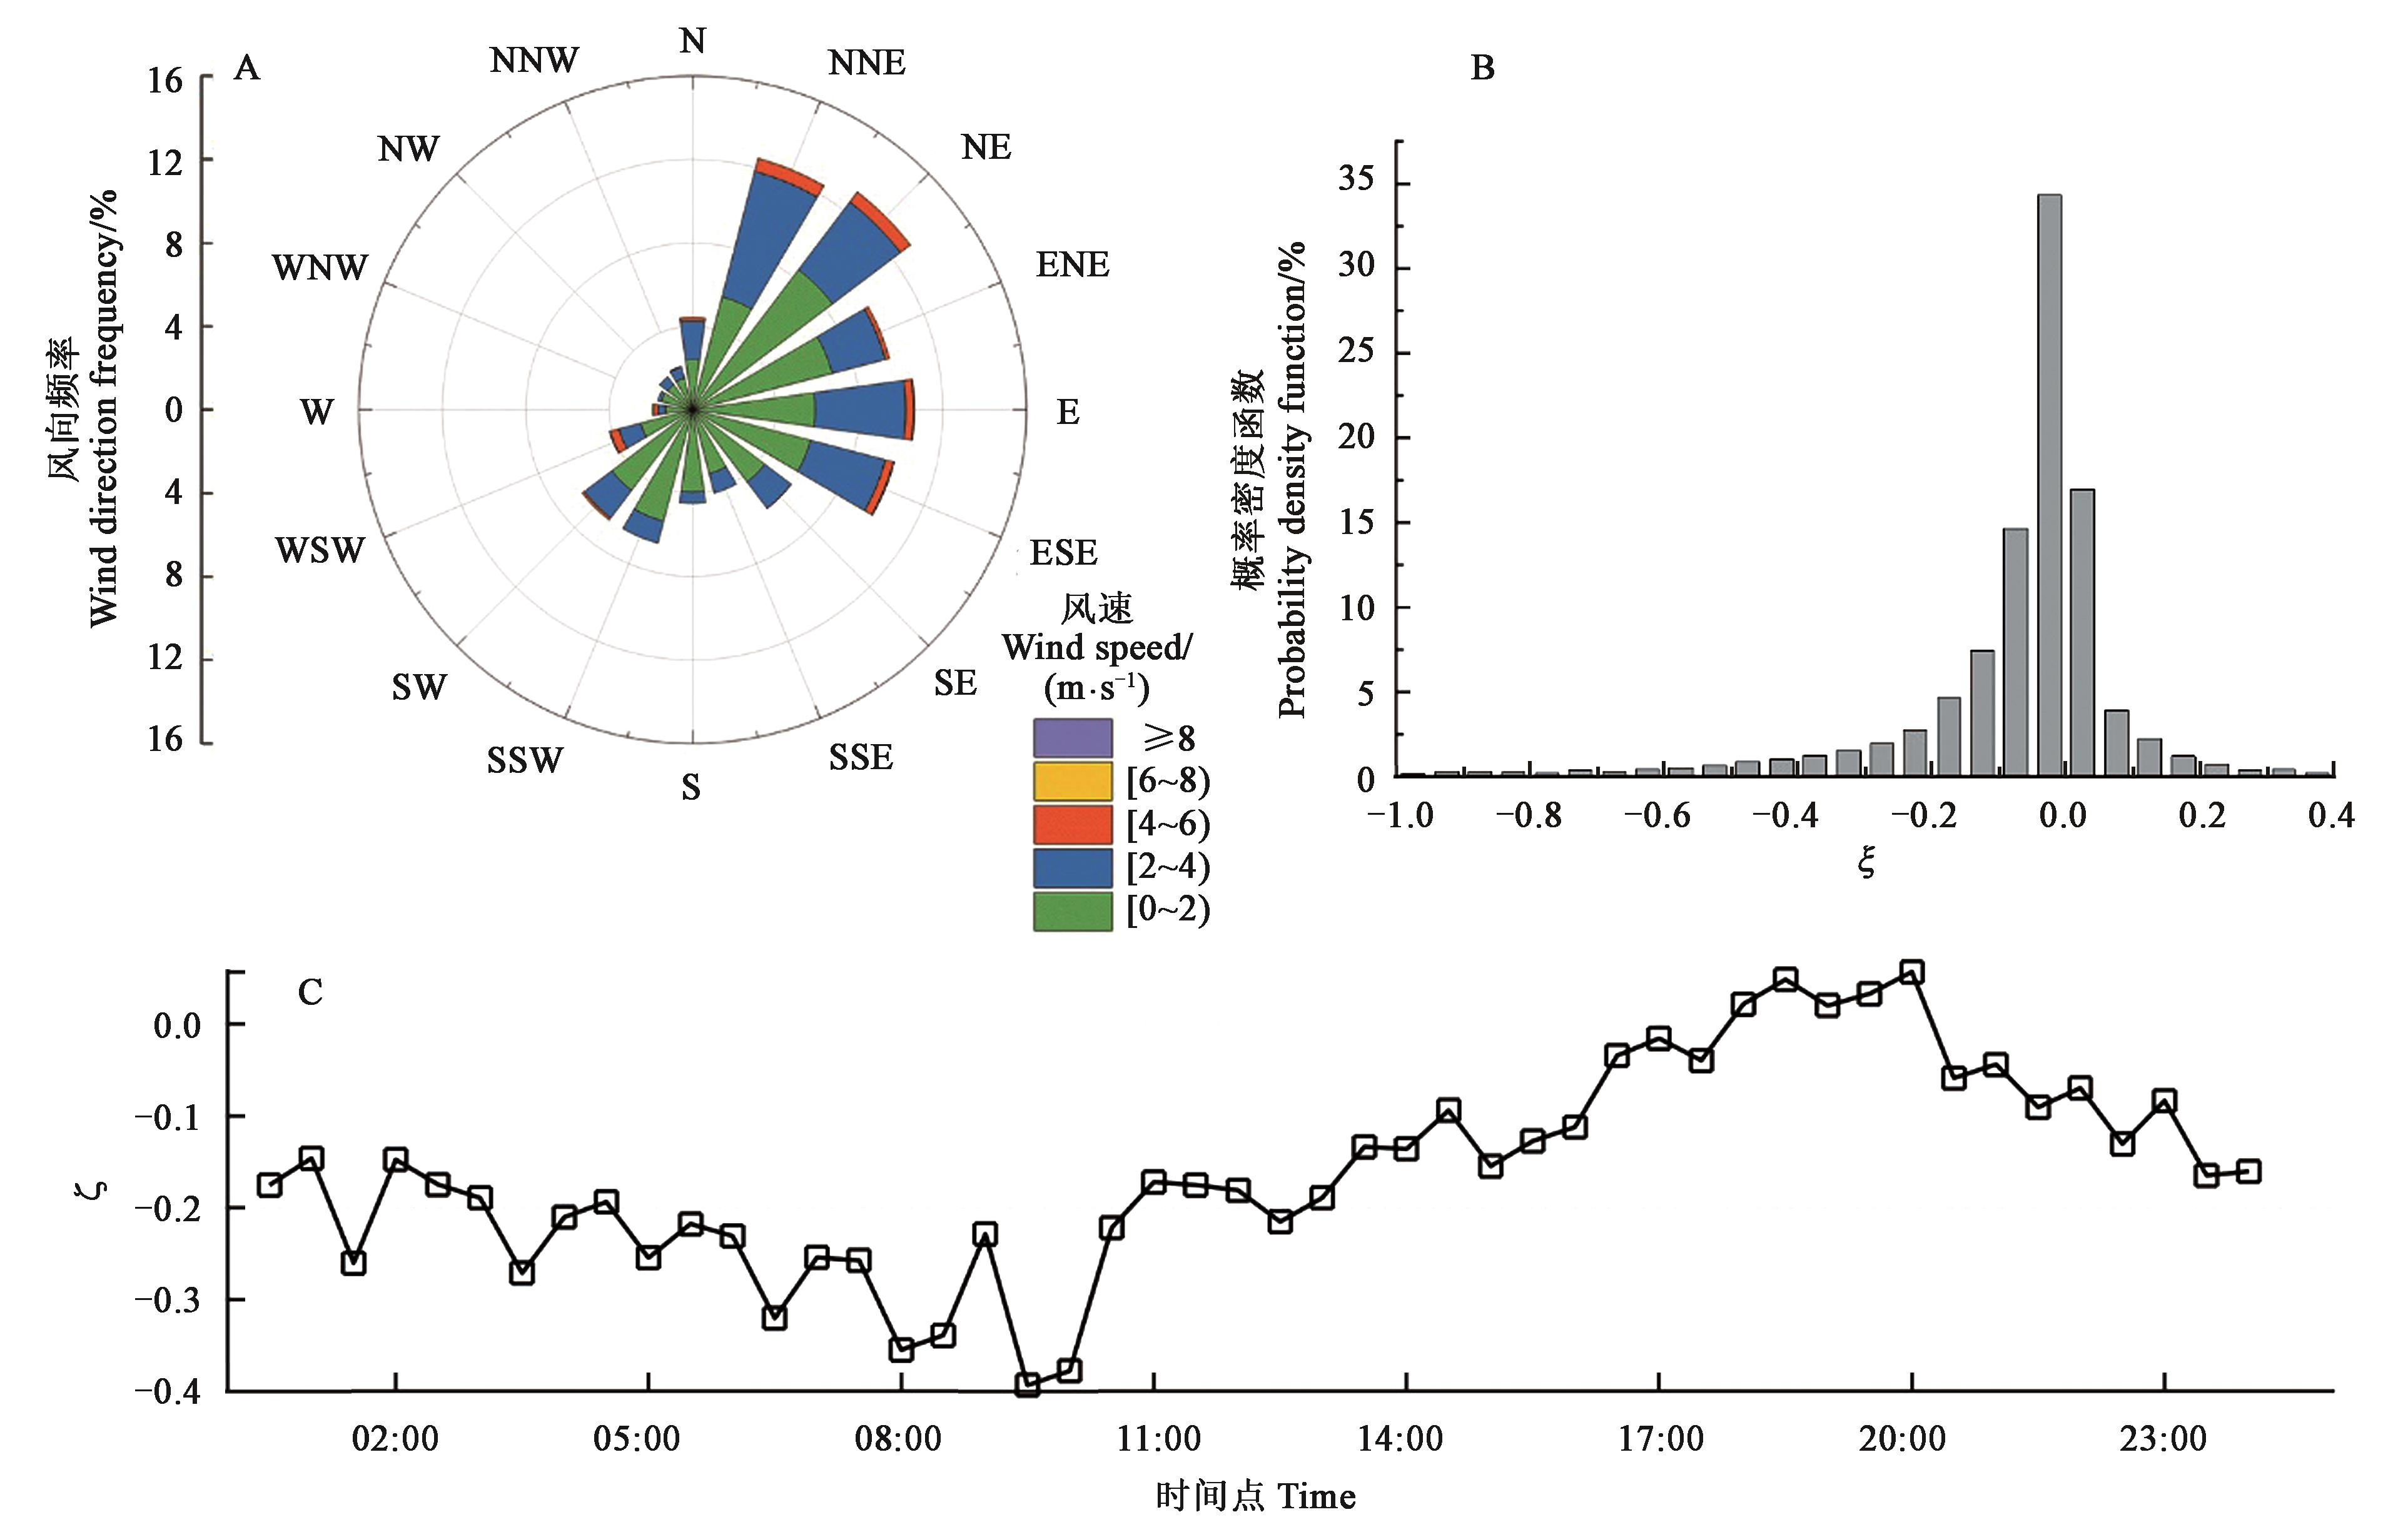
图3 2018年农业养殖塘风向、风速和大气稳定度A:风向玫瑰图;B:大气稳定度概率密度分布;C:大气稳定度日变化;N、E、S、W表示北、东、南、西风向
Fig.3 Wind direction, wind speed and atmospheric stability at fish pond in 2018A: Wind rose; B: Probability density function of atmospheric stability parameter; C: Averaged diurnal variation of atmospheric stability parameter;N, E, S, W indicate wind direction of north, east, south and west, respectively
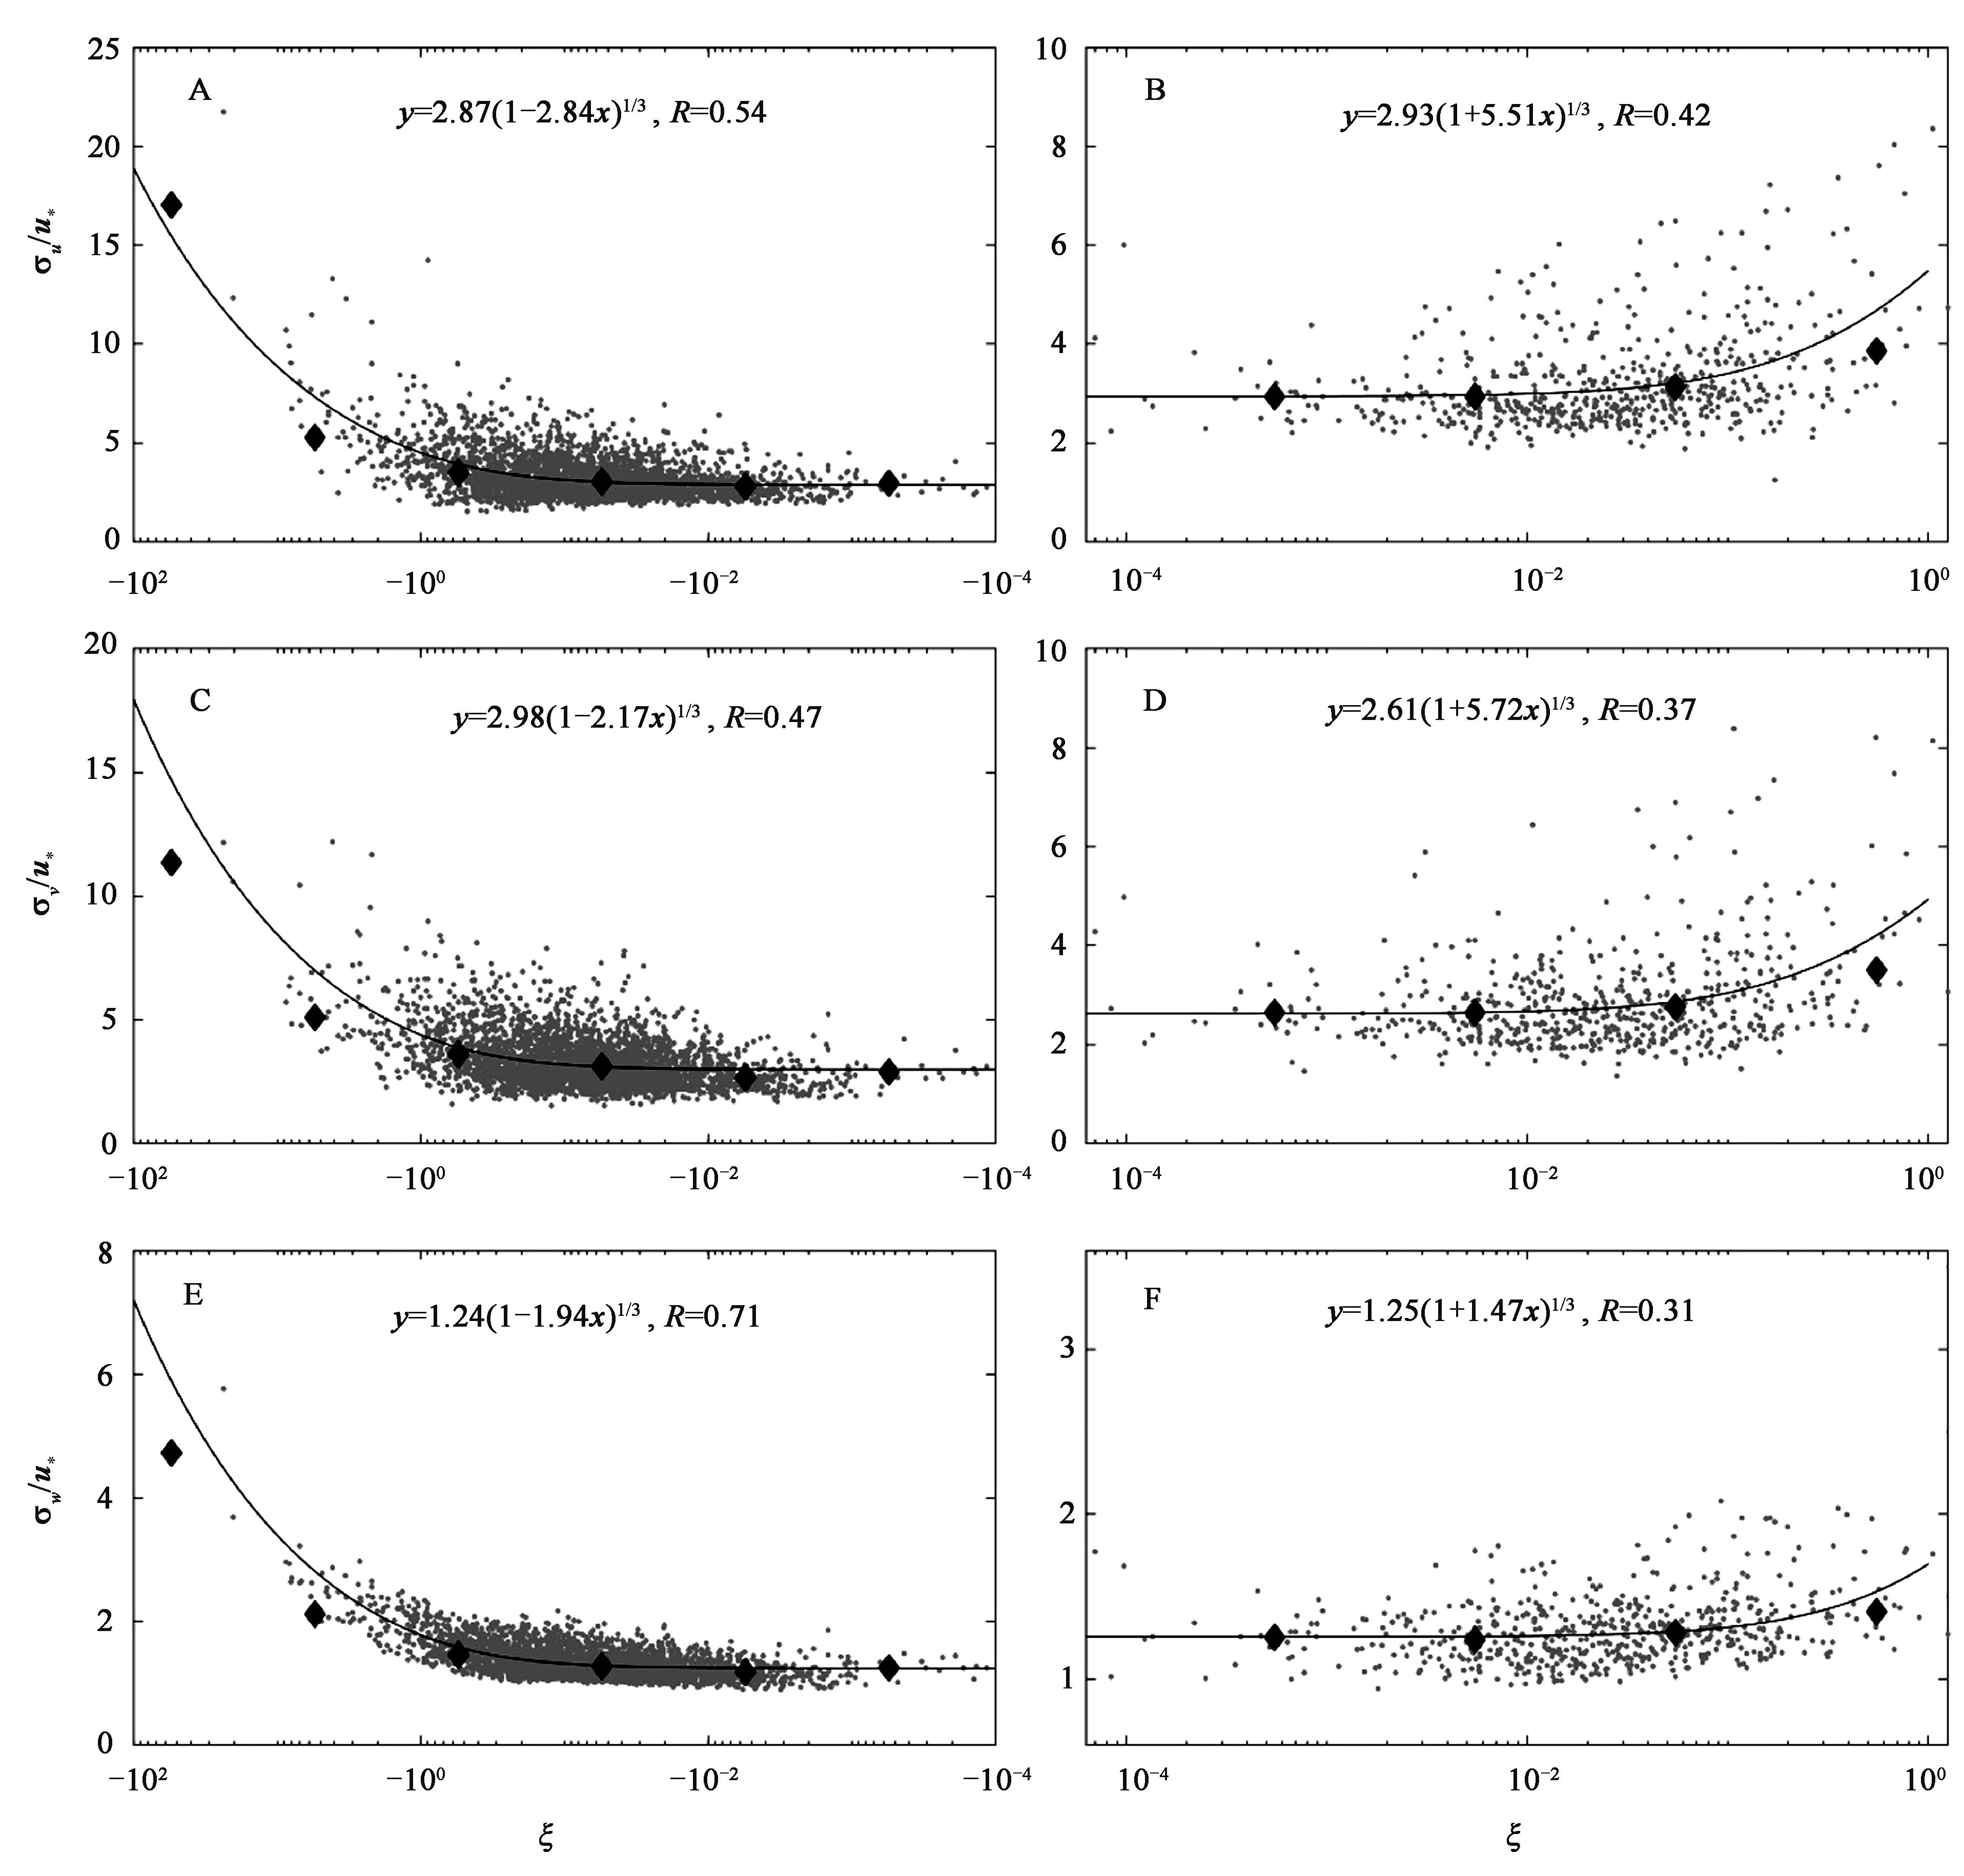
图4 u、v、w风速分量归一化标准差随大气稳定度参数的变化注:A、C、E为不稳定条件下,B、D、F为稳定条件下;菱形为纵坐标在ξ某个区间范围内的平均值,不稳定条件下ξ区间为-102~-101~-100~-10-1~-10-2~-10-3~-10-4,稳定条件下ξ区间为10-4~10-3~10-2~10-1~100。
Fig.4 Normalized standard deviation of u, v, w wind components variation with atmospheric stability parameterNote: A, C, E represen unstable condition, B, D, F represent stable condition. The diamond represent the ordinate ξ average value within a certain interval. ξ interval is -102 to -101 to -100 to -10-1 to -10-2~ to 10-3 to -10-4 under unstable condition, ξ interval is 10-4 to 10-3 to 10-2 to 10-1 to 100 under stable condition.

图5 T、q、c的归一化标准差随大气稳定度参数的变化注:A、C、E为不稳定条件下,B、D、F为稳定条件下;菱形为纵坐标在ξ某个区间范围内的平均值,不稳定条件下ξ区间为-102~-101~-100~-10-1~-10-2~-10-3~-10-4,稳定条件下ξ区间为10-4~10-3~10-2~10-1~100;图A中实线为ξ<-0.05时的拟合线,虚线为-0.05<ξ<0时的拟合线,图E、F中使用bisquare方法进行稳健拟合。
Fig.5 Relationship between normalized standard deviation of T, q, c variation with atmospheric stability parameterNote: A, C, E represen unstable condition, B, D, F represent stable condition. The diamond represent the ordinate ξ average value within a certain interval. ξ interval is -102 to -101 to -100 to -10-1 to -10-2 to 10-3 to -10-4 under unstable condition, ξ interval is 10-4 to 10-3 to 10-2 to 10-1 to 100 under stable condition. The solid lines and dash lines in figure A represent regression for ξ<-0.05 and -0.05<ξ<0, respectively. bisquare robust fitting method was used in figure E and F.

图6 三维风速分量的归一化功率谱注:黑色实线为Kaimal标准曲线[37],虚线为-2/3次方斜率线。
Fig.6 Normalized power spectra of three?dimension wind componentsNote: Solid line represents the standard spectra of Kaimal[37] and dash line represents the -2/3 slope.

图7 垂直风速与T、q、c的协谱注:黑色实线为Kaimal标准曲线[37],虚线为-4/3次方斜率线。
Fig.7 Normalized cospectrum of vertical wind speed with T, q, cNote:Solid line represents the standard cospectrum of Kaimal[37] and dash line represents the -4/3 slope.
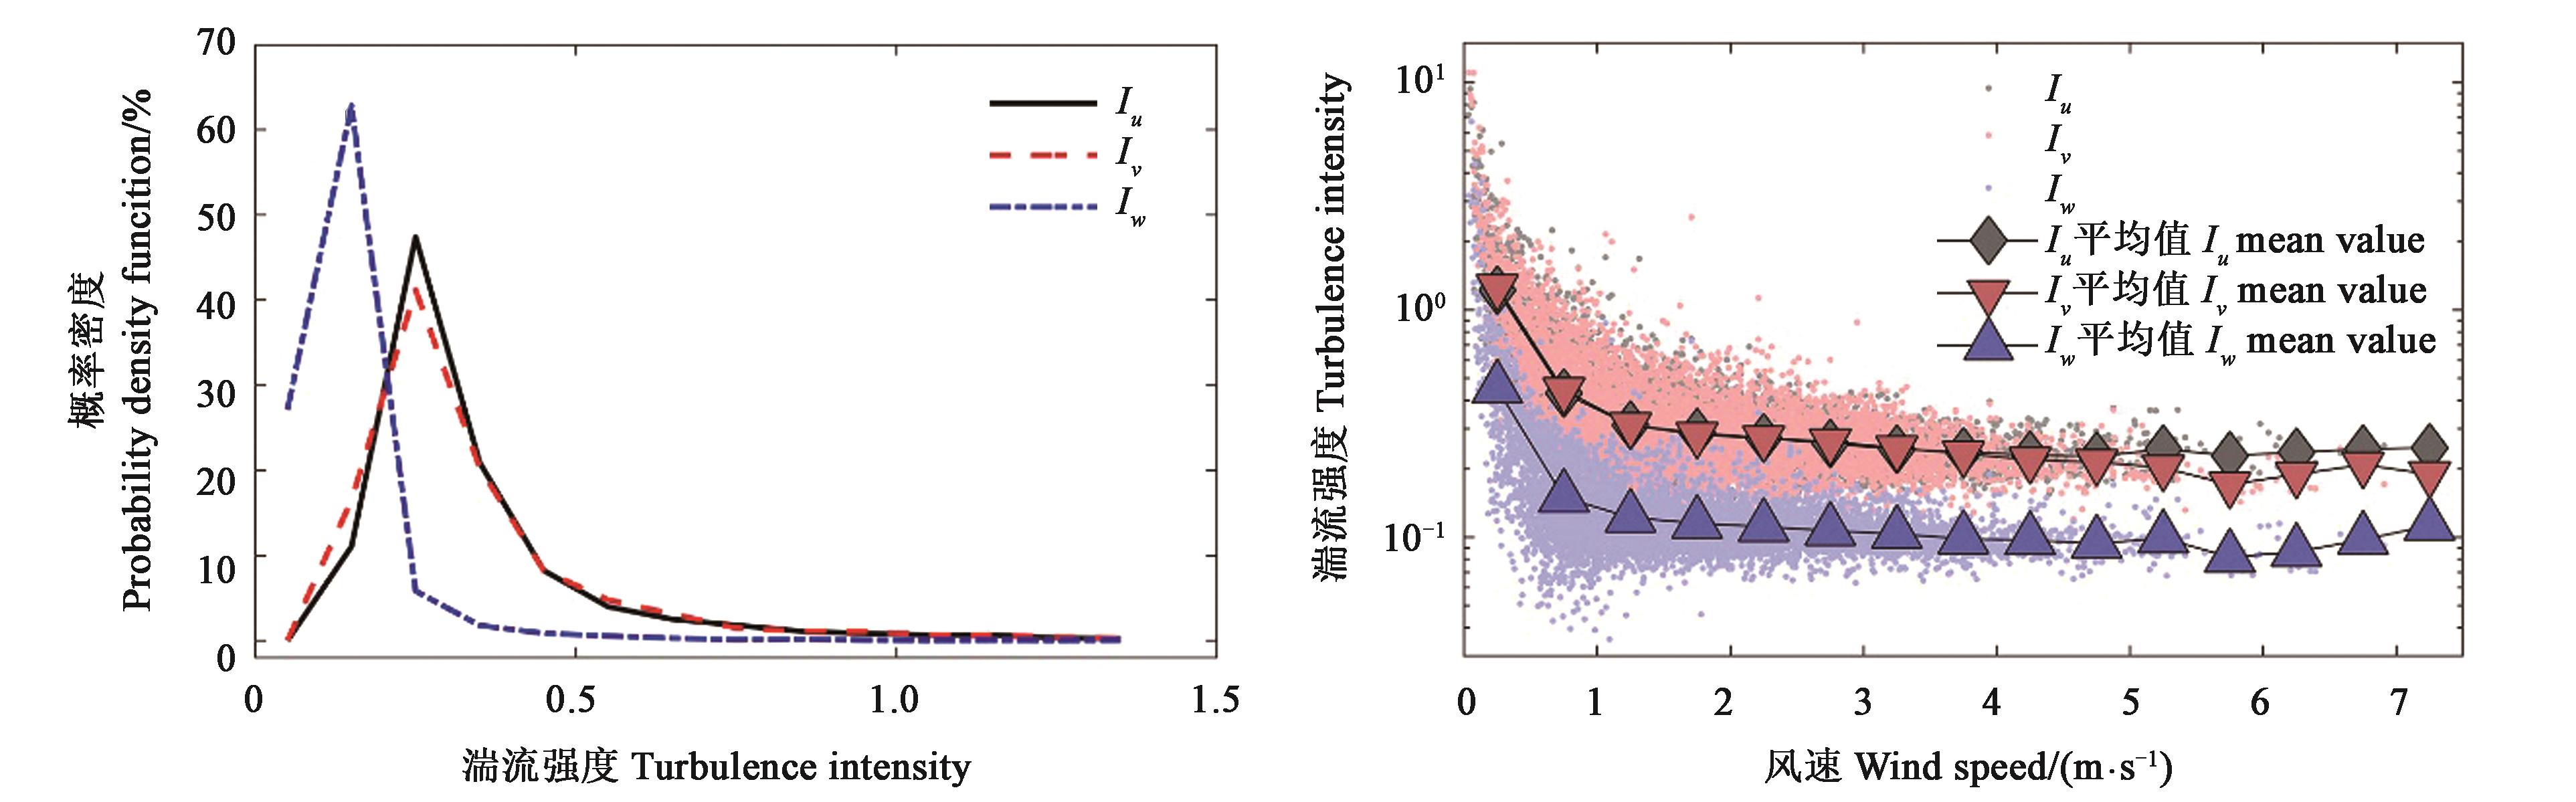
图8 三维风方向上湍流强度的概率密度分布和湍流强度随风速的变化特征注:折线点标记为以0.5为区间的平均值。
Fig.8 The probability density of turbulence intensity in three?dimensional wind speed direction and turbulence intensity of u, v, w components decrease with wind speedNote: Marks at line point are bin averages with width of 0.5.
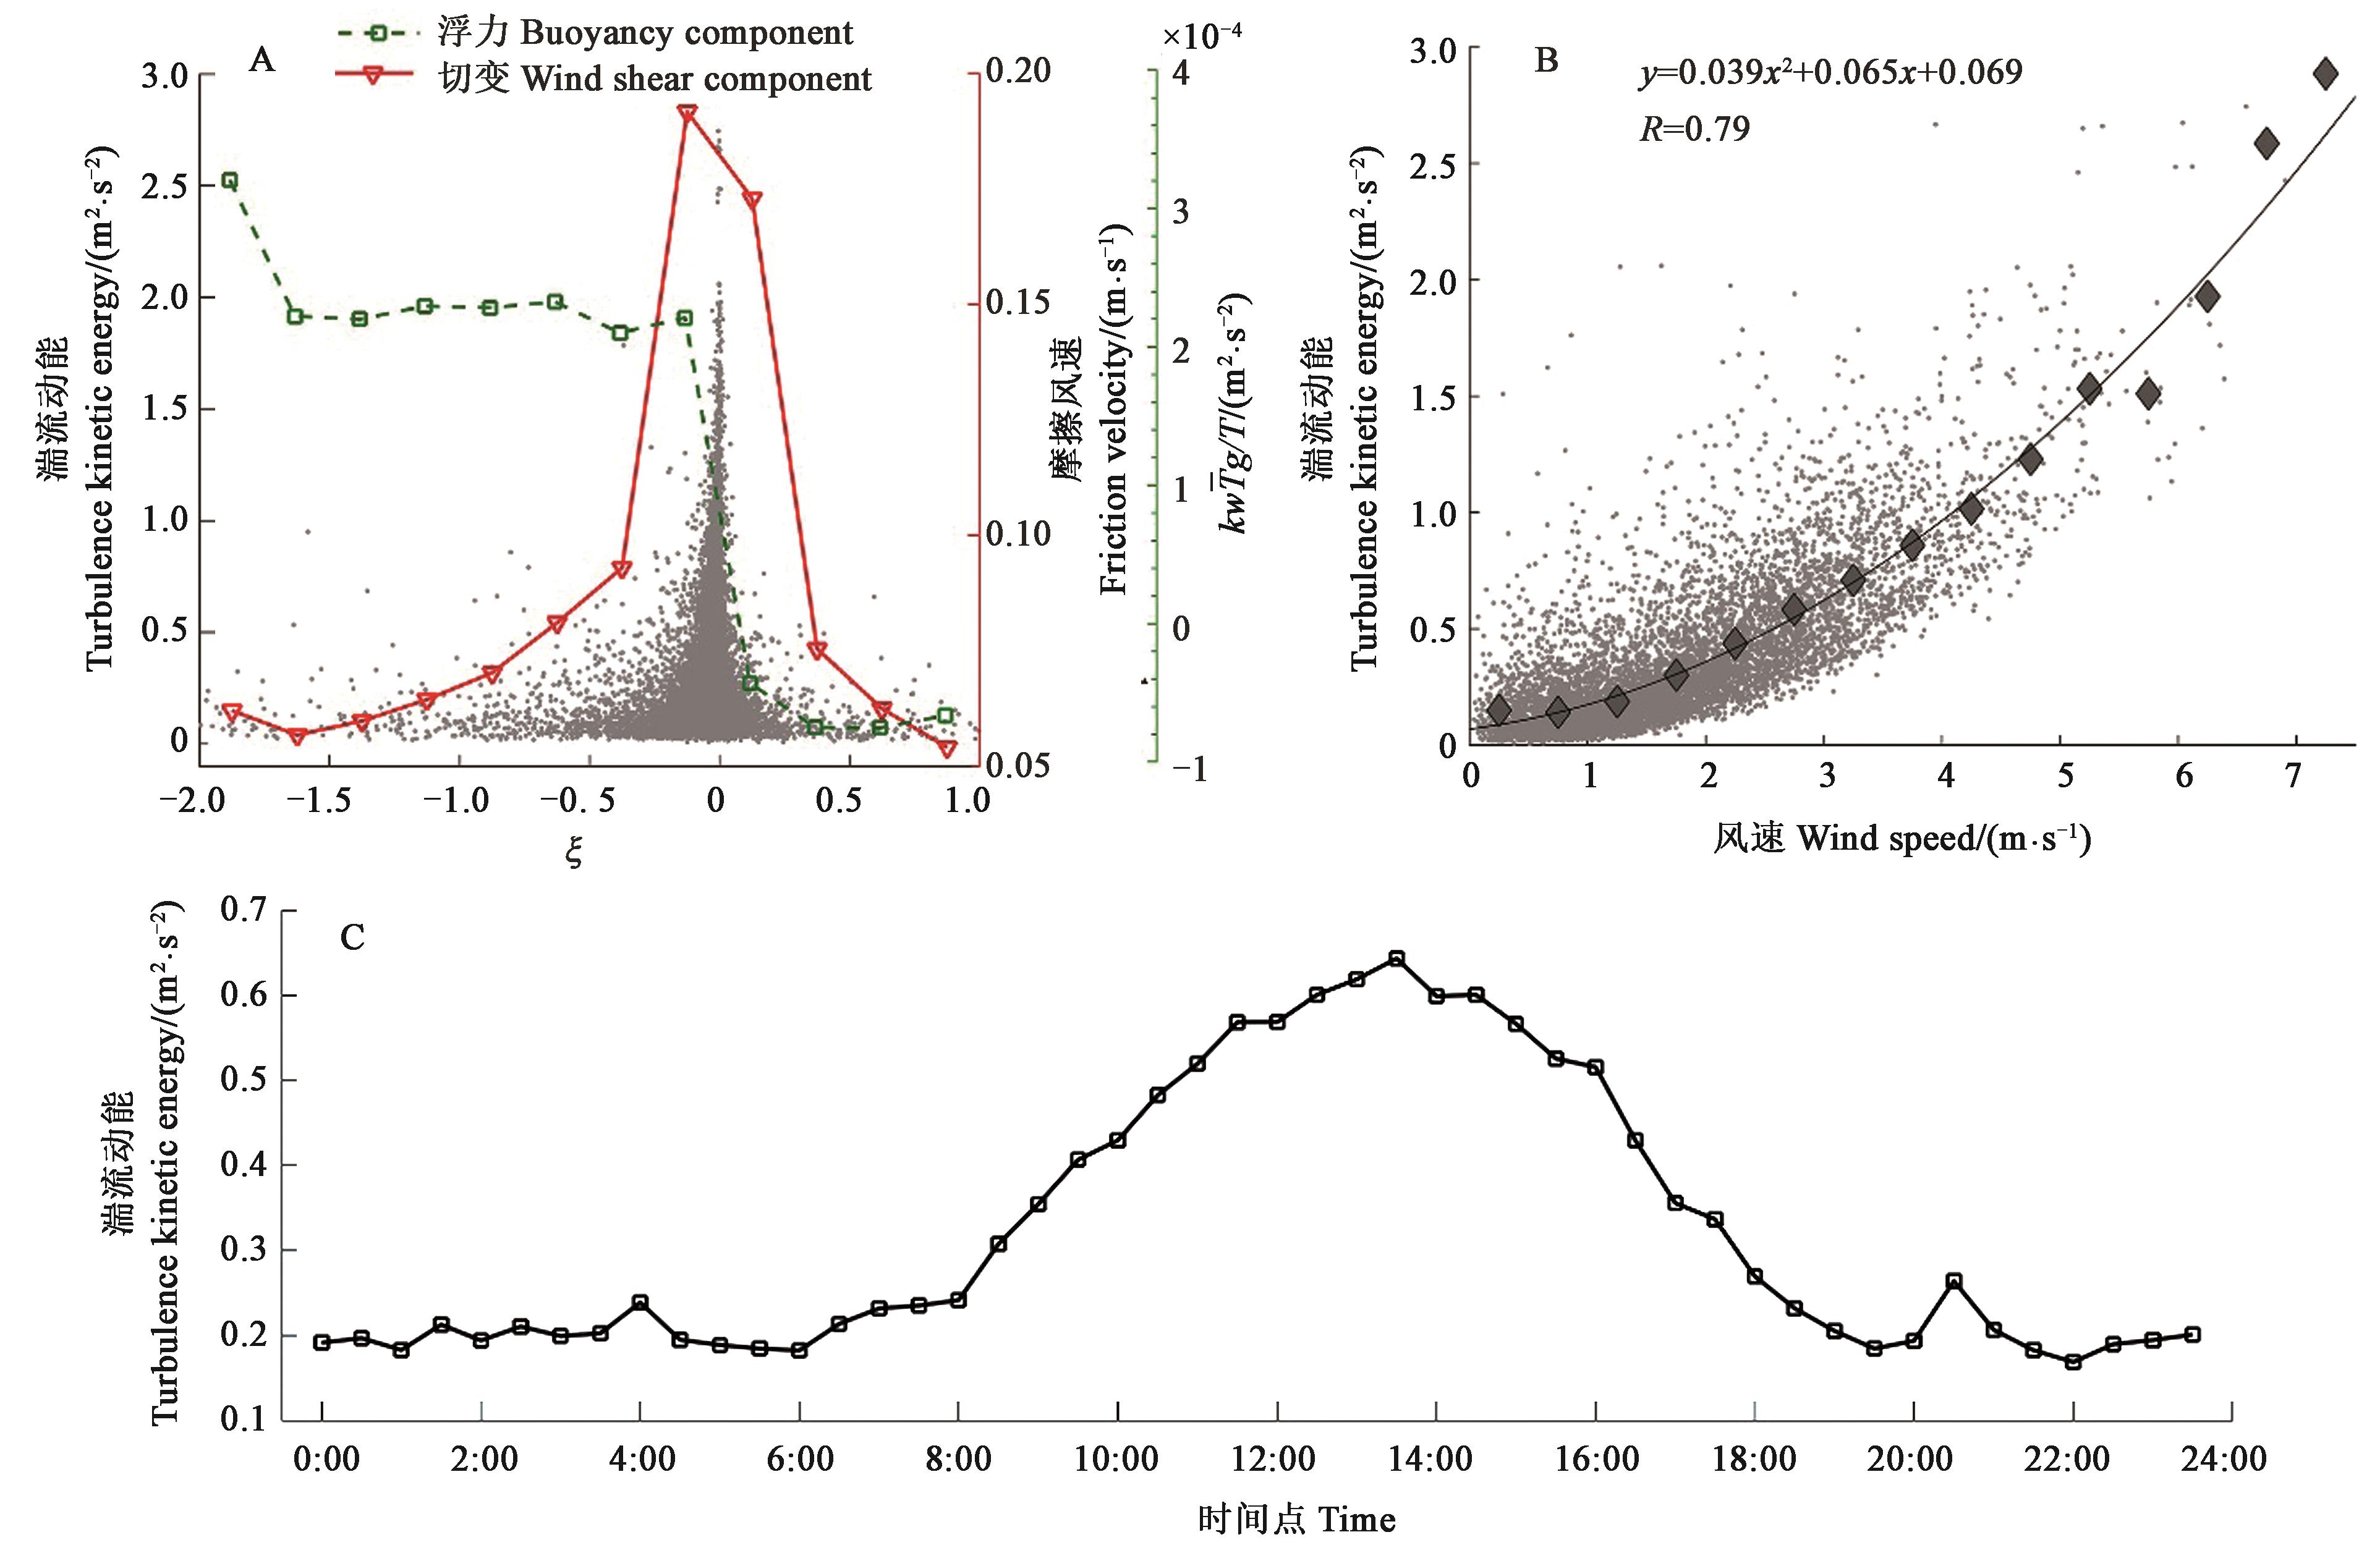
图9 湍流动能随大气稳定度、风速和时间的变化特征A:湍流动能、动力湍流和热力湍流贡献项随大气稳定度的变化;B:湍流动能随风速的变化特征;C:湍流动能的日变化特征。A、B中折线点标记分别为以0.25和0.5为区间的平均值。
Fig.9 Variations in turbulent kinetic energy with atmospheric stability, wind speed and timeA: Turbulent kinetic energy, dynamic turbulence and thermal turbulence varying with atmospheric stability. B: Turbulent kinetic energy varying with wind speed. C: Averaged diurnal variation of turbulent kinetic energy. Marks at line point in A and B are bin averages with width of 0.25 and 0.5, respectively.
| 1 | OSWALD C J, ROUSE W R. Thermal characteristics and energy balance of various-size Canadian Shield lakes in the Mackenzie River Basin [J]. J. Hydrometeorol., 2004, 5(1): 129-144. |
| 2 | DOWNING J A, PRAIRIE Y T, COLE J J, et al.. The global abundance and size distribution of lakes, ponds, and impoundments [J]. Limnol. Oceanogr., 2006, 51(5): 2388-2397. |
| 3 | VERPOORTER C, KUTSER T, SEEKELL D A, et al.. A global inventory of lakes based on high‐resolution satellite imagery [J]. Geophys. Res. Lett., 2014, 41(18): 6396-6402. |
| 4 | LONG Z, PERRIE W, GYAKUM J, et al.. Northern lake impacts on local seasonal climate [J]. J. Hydrometeorol., 2007, 8(4): 881-896. |
| 5 | ROUSE W R, BLANKEN P D, BUSSIÈRES N, et al.. An investigation of the thermal and energy balance regimes of Great Slave and Great Bear Lakes [J]. J. Hydrometeorol., 2008, 9(6): 1318-1333. |
| 6 | YANG S J, RAN G P, ZHANG W, et al.. THE cooling effect of an urban lake landscape on the urban heat island: a case study in Jinan, China [J]. Applied Ecol. Environ. Res., 2020, 18(2): 2197-2211. |
| 7 | 朱春阳.城市湖泊湿地温湿效应——以武汉市为例 [J].生态学报,2015,35(16): 5518-5527. |
| ZHU C Y. Effects of urban lake wetland on temperature and humidity: a case study of Wuhan City [J]. Acta Ecol. Sin., 2015, 35(16): 5518-5527. | |
| 8 | WETZEL R G. Gradient-dominated ecosystems: sources and regulatory functions of dissolved organic matter in freshwater ecosystems[J]. Hydrobiologia, 1992, 229(1): 181-198. |
| 9 | BASTVIKEN D, TRANVIK L J, DOWNING J A, et al.. Freshwater methane emissions offset the continental carbon sink [J/OL]. Science, 2011, 331(6013): 50 [2022-03-17]. . |
| 10 | HOLGERSON M A, RAYMOND P A. Large contribution to inland water CO2 and CH4 emissions from very small ponds [J]. Nature Geosci., 2016, 9(3): 222-226. |
| 11 | MONCRIEFF J B, MASSHEDER J M, DE BRUIN H, et al.. A system to measure surface fluxes of momentum, sensible heat, water vapour and carbon dioxide [J]. J. Hydrol., 1997, 188: 589-611. |
| 12 | BALDOCCHI D, FALGE E, GU L, et al.. FLUXNET: a new tool to study the temporal and spatial variability of ecosystem-scale carbon dioxide, water vapor, and energy flux densities [J]. Bull. Am. Meteorol. Soc., 2001, 82(11): 2415-2434. |
| 13 | YU G R, WEN X F, SUN X M, et al.. Overview of China FLUX and evaluation of its eddy covariance measurement [J]. Agric. For. Meteorol., 2006, 137(3-4): 125-137. |
| 14 | ZHAO J, ZHANG M, XIAO W, et al.. An evaluation of the flux-gradient and the eddy covariance method to measure CH4, CO2, and H2O fluxes from small ponds [J]. Agric. For. Meteorol., 2019, 275: 255-264. |
| 15 | WOLF A, SALIENDRA N, AKSHALOV K, et al.. Effects of different eddy covariance correction schemes on energy balance closure and comparisons with the modified Bowen ratio system [J]. Agric. For. Meteorol., 2008, 148(6-7): 942-952. |
| 16 | FOKEN T. 50 years of the Monin-Obukhov similarity theory [J]. Boundary-Layer Meteorol., 2006, 119(3): 431-447. |
| 17 | FALGE E, BALDOCCHI D, OLSON R, et al.. Gap filling strategies for long term energy flux data sets [J]. Agric.For. Meteorol., 2001, 107(1): 71-77. |
| 18 | GAO Z, LIU H, LI D, et al.. Enhanced temperature‐humidity similarity caused by entrainment processes with increased wind shear [J]. J. Geophys. Res. Atmos., 2018, 123(8): 4110-4121. |
| 19 | FAO. The State of World Fisheries and Aquaculture 2018 - Meeting the Sustainable Development Goals [R]. Rome: Food and Agriculture Organization of the United Nations, 2018: 26-30. |
| 20 | 农业部渔业渔政管理局.中国渔业统计年鉴[M].北京:中国农业出版社,2019:46-49. |
| Fisheries and Fishery Administration Bureau of the Ministry of Agriculture and Rural Areas. China Fishery Statistical Yearbook [M]. Beijing: China Agriculture Press, 2019: 46-49. | |
| 21 | VICKERS D, MAHRT L. Quality control and flux sampling problems for tower and aircraft data [J]. J. Atmos. Oceanic Technol., 1997, 14(3): 512-526. |
| 22 | WILCZAK J M, ONCLEY S P, STAGE S A. Sonic anemometer tilt correction algorithms [J]. Bound-lay. Meteorol., 2001, 99(1): 127-150. |
| 23 | Schotanus P, Nieuwstadt F T M, De Bruin H A R. Temperature measurement with a sonic anemometer and its application to heat and moisture fluxes [J]. Bound-lay. Meteorol., 1983, 26(1): 81-93. |
| 24 | WEBB E K, PEARMAN G I, LEUNING R. Correction of flux measurements for density effects due to heat and water vapour transfer [J]. Quart. J. R. Met. Soc., 1980, 106(447): 85-100. |
| 25 | LEE X, MASSMAN W J, LAW B E. Handbook of microme-teorology [M]. Netherlands: Kluwer Academic Publishers, 2005: 7-31. |
| 26 | Mauder M, Cuntz M, DrüeClemens, et al. A strategy for quality and uncertainty assessment of long-term eddy-covariance measurements [J]. Agric.For. Meteorol., 2013, 169: 122-135. |
| 27 | LIU S M, XU Z W, ZHU Z L, et al.. Measurements of evapotranspiration from eddy-covariance systems and large aperture scintillometers in the Hai River Basin, China [J]. J. Hydrol., 2013, 487: 24-38. |
| 28 | KLJUN N, CALANCA P, ROTACH M W, et al.. A simple two-dimensional parameterisation for Flux Footprint Prediction (FFP) [J]. Geosci. Model Dev., 2015, 8(11): 3695-3713. |
| 29 | Panofsky H A.Dutton J A. Atmospheric Turbulence: Models and Methods for Engineering Applications[M]. New York: Wiley, 1984: 133-148. |
| 30 | TILLMAN J E. The indirect determination of stability, heat and momentum fluxes in the atmospheric boundary layer from simple scalar variables during dry unstable conditions [J]. J. Appl. Meteorol., 1972, 11(5): 783-792. |
| 31 | SFYRI E, ROTACH M W, STIPERSKI I, et al.. Scalar-flux similarity in the layer near the surface over mountainous terrain [J]. Bound. Meteorol., 2018, 169(1): 11-46. |
| 32 | 于贵瑞,孙晓敏.陆地生态系统通量观测的原理与方法[M].第2版.北京: 高等教育出版社,2018:226-229. |
| 33 | KOLMOGOROV A N. The local structure of turbulence in incompressible viscous fluid for very large Reynolds numbers [J]. Proc. Royal Society A Math., 1991, 434(1890): 9-13. |
| 34 | LEE X. Fundamentals of Boundary-layer Meteorology [M]. Switzerland: Springer, 2018, 64-68. |
| 35 | 王伟,申双和,刘寿东,等.太湖生态系统能量闭合特征及其影响因素[J].生态学报,2017,37(18):5935-5950. |
| WANG W, SHEN S H, LIU S D, et al.. Mechanistic analysis of the observed energy imbalance of Lake Taihu [J]. Acta Ecol. Sin., 2017, 37(18): 5935-5950. | |
| 36 | VERBURG P, ANTENUCCI J P. Persistent unstable atmospheric boundary layer enhances sensible and latent heat loss in a tropical great lake: Lake Tanganyika [J/OL]. J. Geophys. Res. Atmos., 2013,118(11):5347[2022-03-17]. . |
| 37 | KAIMAL J C, WYNGAARD J C J, IZUMI Y, et al.. Spectral characteristics of surface‐layer turbulence [J]. Quart. J. Royal Meteorol. Society, 1972, 98(417): 563-589. |
| 38 | MAMMARELLA I, NORDBO A, RANNIK Ü, et al.. Carbon dioxide and energy fluxes over a small boreal lake in Southern Finland [J]. J. Geo. Res. Biogeosci., 2015, 120(7): 1296-1314. |
| 39 | 胡文峰,王乃昂,赵力强,等.巴丹吉林沙漠典型湖泊湖气界面水一热交换特征[J].地理科学进展,2015,34(8):1061-1071. |
| HU W F, WANG N A, ZHAO L Q, et al.. Water-heat exchange over a typical lake in Badain Jaran Desert, China [J]. Progress Geography, 2015, 34(8): 1061-1071. | |
| 40 | GRACHEV A A, LEO L S, FERNANDO H J S, et al.. Air-sea/land interaction in the coastal zone [J]. Bound-lay. Meteorol., 2018, 167(2): 181-210. |
| 41 | STIPERSKI I, CALAF M, ROTACH M W. Scaling, anisotropy, and complexity in near‐surface atmospheric turbulence [J]. J. Geography Res. Atmos., 2019, 124(3): 1428-1448. |
| 42 | 沈鹏珂,张雪芹.藏南羊卓雍错湖面大气湍流特征观测分析[J].湖泊科学,2019,31(1):243-255. |
| SHEN P K, ZHANG X Q. Observation of atmospheric turbulence characteristics over the Yamzhog Yumco, south Tibet [J]. J. Lake Sci., 2019, 31(1):243-255. | |
| 43 | XIAO W, LIU S, WANG W, et al.. Transfer coefficients of momentum, heat and water vapour in the atmospheric surface layer of a large freshwater lake [J]. Bound-lay. Meteorol., 2013, 148(3): 479-494. |
| 44 | PRASAD K H, SRINIVAS C V, SINGH A B, et al.. Turbulence characteristics of surface boundary layer over the Kalpakkam tropical coastal station, India [J]. Meteorol. Atmos. Physics, 2019, 131(4): 827-843. |
| 45 | 王洁,段自强,姚小红,等.西北太平洋船载海面风速脉动资料校正及湍流特征分析[J].热带海洋学报,2013,32(3): 9-15. |
| WANG J, DUAN Z Q, YAO X H, et al.. Correction of ship-based turbulent wind velocity and characterization of turbulence in the Northwest Pacific [J]. J. Tropical Oceanogr., 2013, 32(3): 9-15. | |
| 46 | ZHANG H, CHEN J, PARK S U. Turbulence structure in unstable conditions over various surfaces [J]. Bound-lay. Meteorol., 2001, 100(2): 243-261. |
| 47 | 刘衡,蒋维楣.近地层湍流特征及其在扩散模拟中的应用[J].高原气象,1998,17(4): 390-396. |
| LIU H, JIANG W M. Analysis on turbulent characteristics in the atmospheric surface layer and some exploring in the applications of diffusion modeling [J]. Plateau Meteorol., 1998, 17(4): 390-396. |
| No related articles found! |
| 阅读次数 | ||||||
|
全文 |
|
|||||
|
摘要 |
|
|||||
 京公网安备11010802021197号