


Journal of Agricultural Science and Technology ›› 2023, Vol. 25 ›› Issue (4): 215-224.DOI: 10.13304/j.nykjdb.2021.0903
• MARINE AGRICULTURE & FRESHWATER FISHERIES • Previous Articles
Hongjun GUAN1,2( ), Yuhuan CHEN1, Aiwu ZHAO1,2
Received:2021-10-23
Accepted:2022-03-27
Online:2023-04-01
Published:2023-06-26
关洪军1,2(), 陈玉环1, 赵爱武1,2
作者简介:关洪军 E-mail:jjxyghj@sdufe.edu.cn
基金资助:CLC Number:
Hongjun GUAN, Yuhuan CHEN, Aiwu ZHAO. Assessment of Carbon Neutrality Capacity of China’s Marine Fisheries[J]. Journal of Agricultural Science and Technology, 2023, 25(4): 215-224.
关洪军, 陈玉环, 赵爱武. 中国海洋渔业碳中和能力评估[J]. 中国农业科技导报, 2023, 25(4): 215-224.
| 种类Specie | 干湿重转换系数Dry weight/wet weight/% | 质量比重Proportion of weight/% | 碳含量Carbon content/% | 参考文献Reference | ||
|---|---|---|---|---|---|---|
| 软组织Soft tissue | 贝壳Shell | 软组织Soft tissue | 贝壳Shell | |||
| 蛤Clam | 52.55 | 1.98 | 98.02 | 44.90 | 11.52 | [ |
| 扇贝Scallop | 63.89 | 14.35 | 85.65 | 42.84 | 11.40 | [ |
| 牡蛎Oyster | 65.10 | 6.14 | 93.86 | 45.98 | 12.68 | [ |
| 贻贝Mussel | 75.28 | 8.47 | 91.53 | 44.40 | 11.76 | [ |
| 其他贝类Other shellfishs | 64.21 | 11.41 | 88.59 | 43.87 | 11.44 | [ |
| 海带Kelp | 20.00 | 100.00 | 31.20 | [ | ||
| 裙带菜Wakame | 20.00 | 100.00 | 26.40 | [ | ||
| 紫菜Laver | 20.00 | 100.00 | 27.39 | [ | ||
| 江蓠Gracilaria | 20.00 | 100.00 | 20.60 | [ | ||
| 其他藻类Other algaes | 20.00 | 100.00 | 27.76 | [ | ||
Table 1 Calculation coefficient of carbon sink capacity of marine aquaculture
| 种类Specie | 干湿重转换系数Dry weight/wet weight/% | 质量比重Proportion of weight/% | 碳含量Carbon content/% | 参考文献Reference | ||
|---|---|---|---|---|---|---|
| 软组织Soft tissue | 贝壳Shell | 软组织Soft tissue | 贝壳Shell | |||
| 蛤Clam | 52.55 | 1.98 | 98.02 | 44.90 | 11.52 | [ |
| 扇贝Scallop | 63.89 | 14.35 | 85.65 | 42.84 | 11.40 | [ |
| 牡蛎Oyster | 65.10 | 6.14 | 93.86 | 45.98 | 12.68 | [ |
| 贻贝Mussel | 75.28 | 8.47 | 91.53 | 44.40 | 11.76 | [ |
| 其他贝类Other shellfishs | 64.21 | 11.41 | 88.59 | 43.87 | 11.44 | [ |
| 海带Kelp | 20.00 | 100.00 | 31.20 | [ | ||
| 裙带菜Wakame | 20.00 | 100.00 | 26.40 | [ | ||
| 紫菜Laver | 20.00 | 100.00 | 27.39 | [ | ||
| 江蓠Gracilaria | 20.00 | 100.00 | 20.60 | [ | ||
| 其他藻类Other algaes | 20.00 | 100.00 | 27.76 | [ | ||
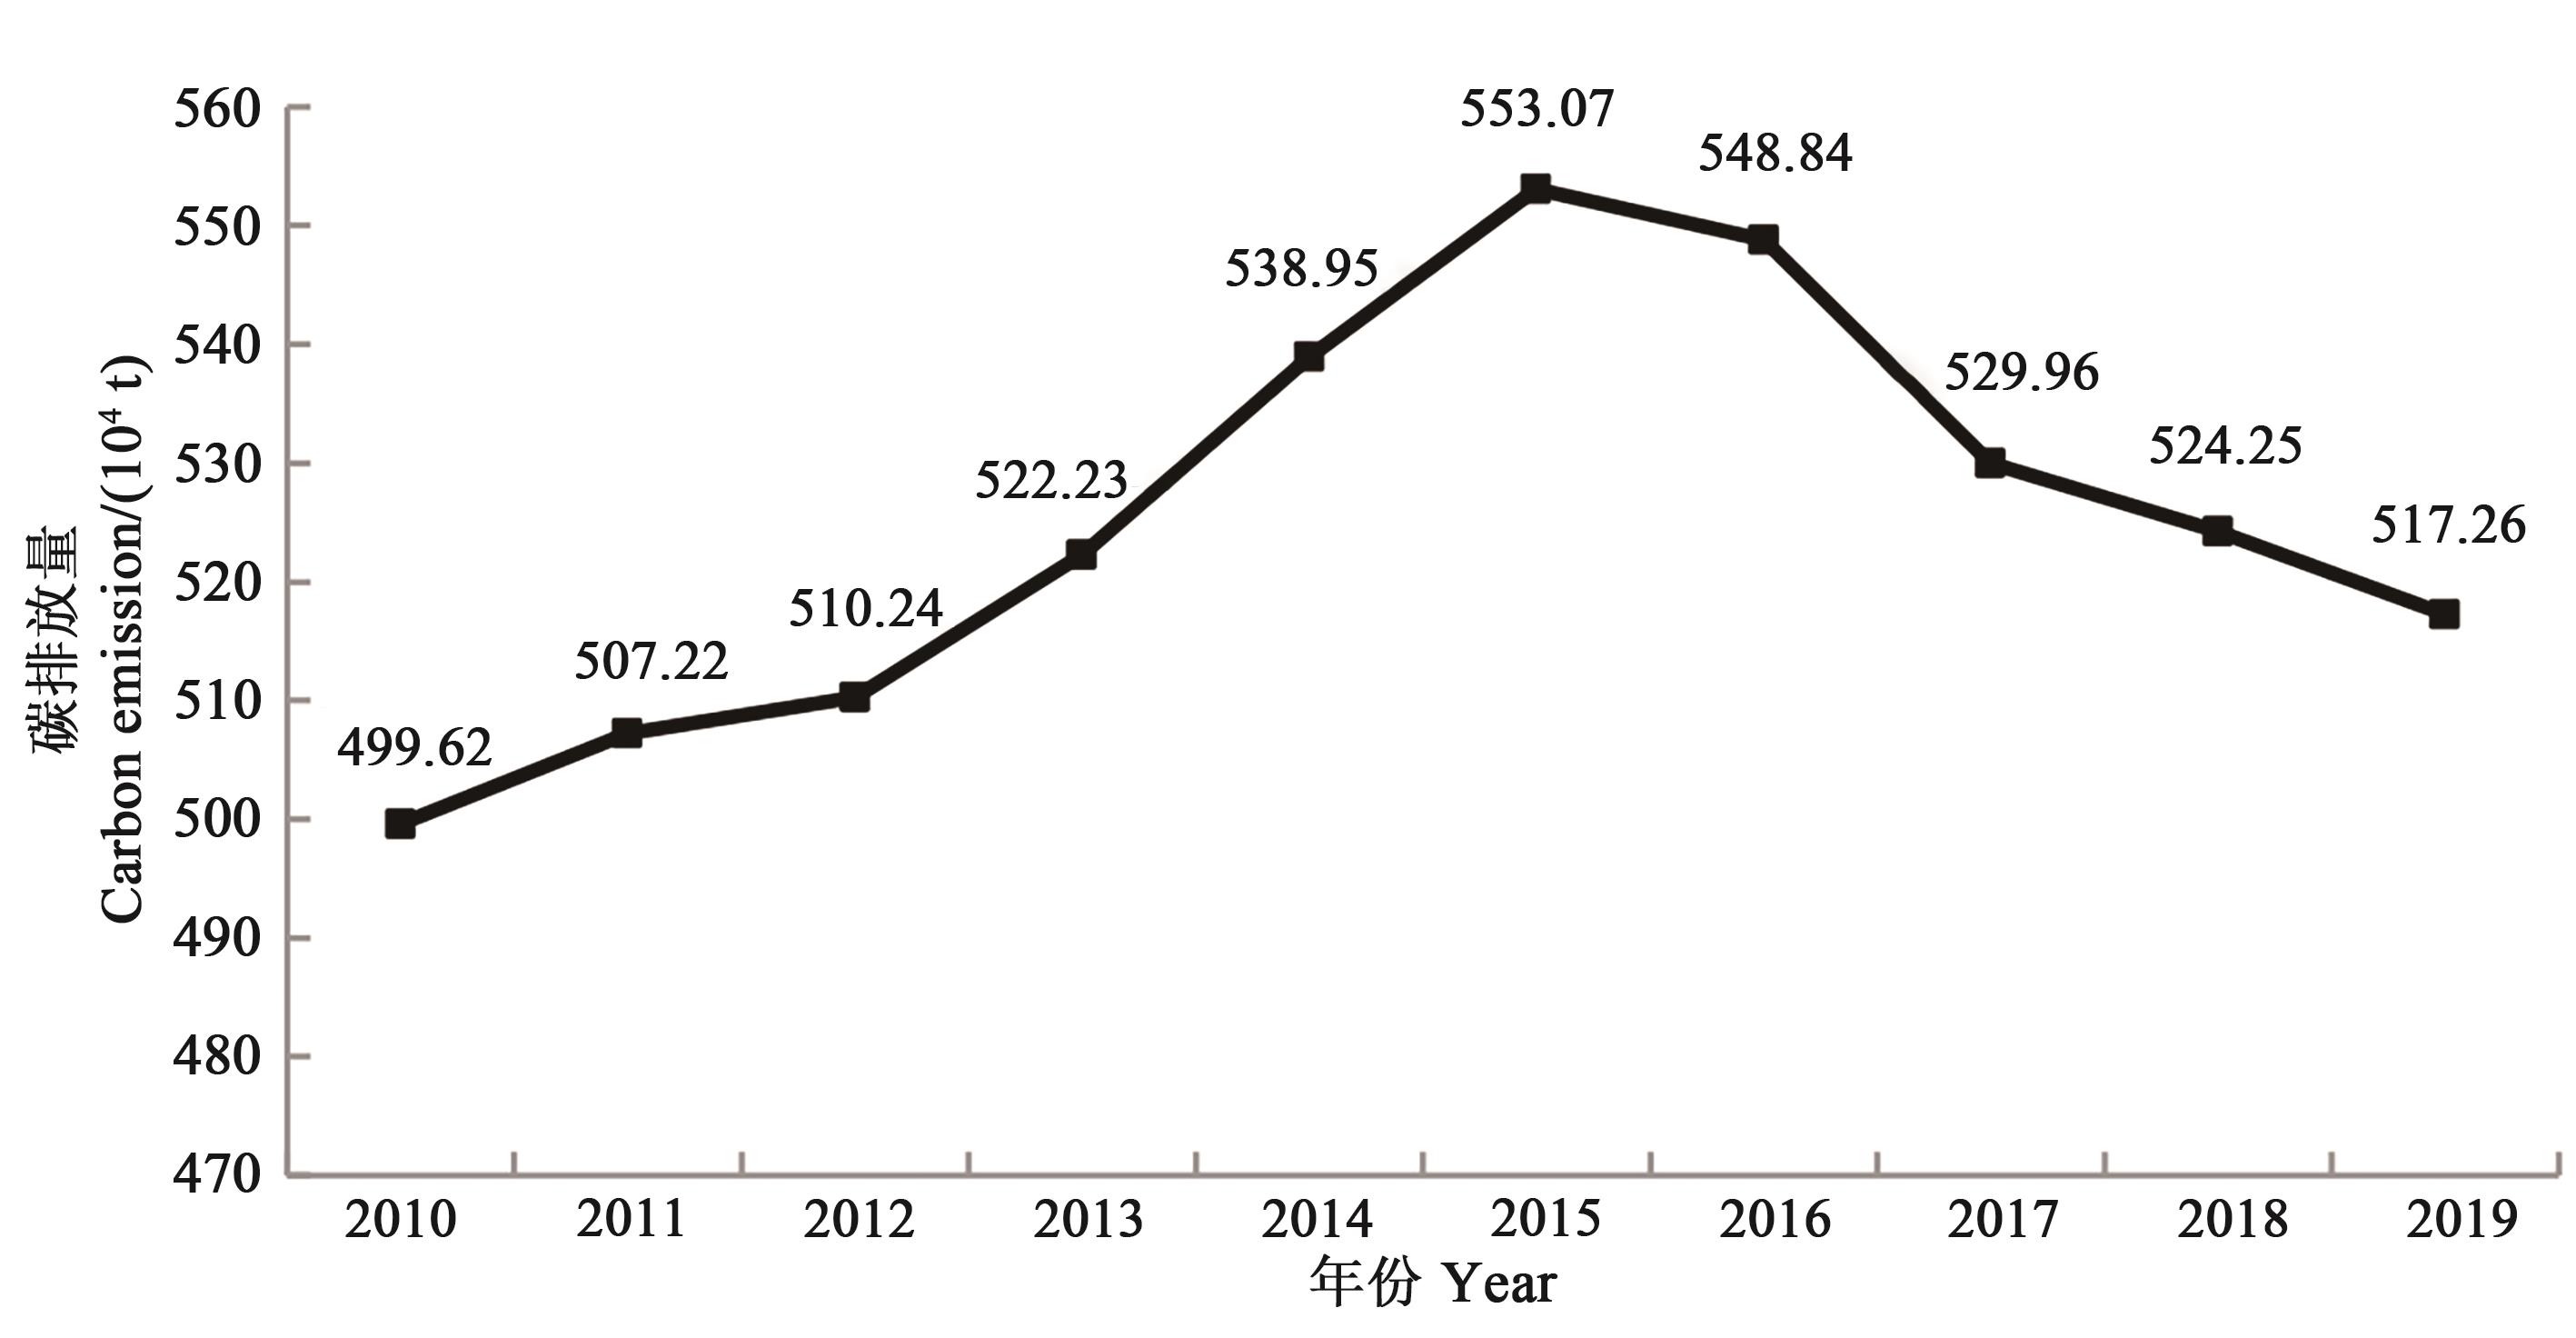
Fig. 1 Carbon emissions from China’s marine fisheries from 2010 to 2019
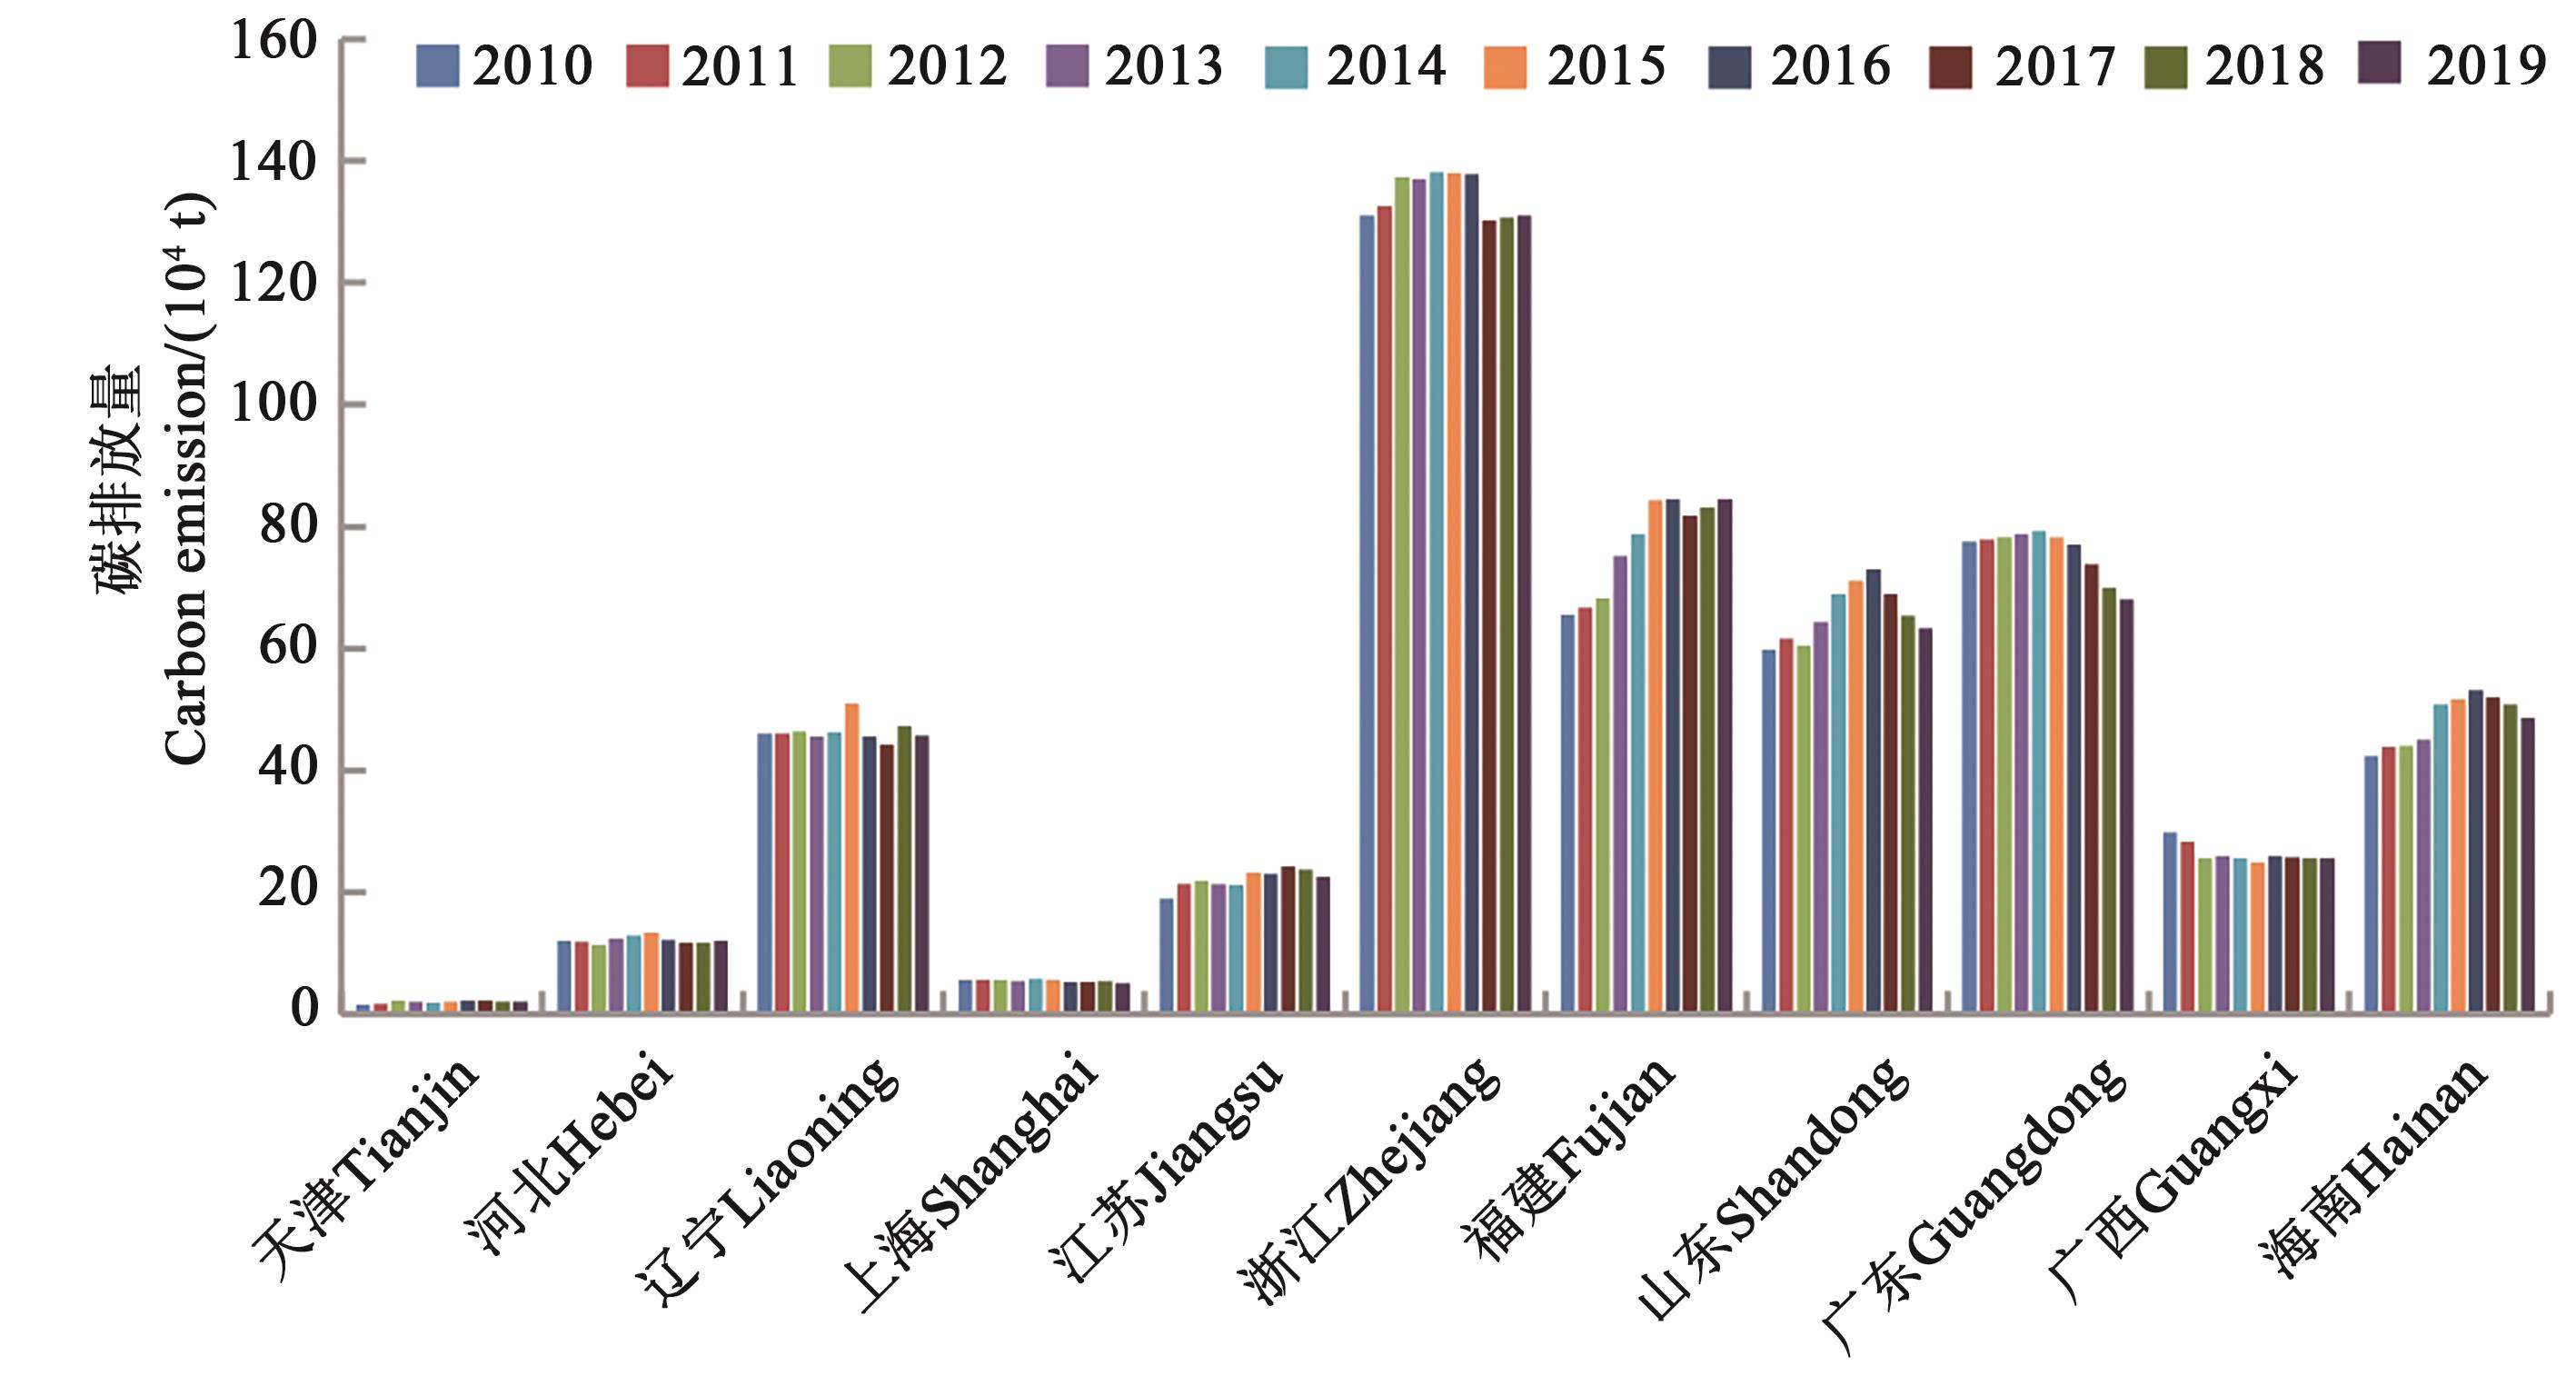
Fig. 2 Provincial results of China’s marine fishery carbon emissions from 2010 to 2019
省(自治区、直辖市) Province(antomomows region, municipality) | 天津Tianjin | 河北Hebei | 辽宁Liaoning | 上海Shanghai | 江苏Jiangsu | 浙江Zhejiang | 福建Fujian | 山东Shandong | 广东Guangdong | 广西Guangxi | 海南Hainan |
|---|---|---|---|---|---|---|---|---|---|---|---|
| 排放量/产量 Emissions/production | 0.72± 0.30 | 0.52± 0.05 | 0.57±0.22 | 3.15± 0.53 | 0.42±0.06 | 0.44±0.03 | 0.42±0.06 | 0.31±0.05 | 0.53± 0.02 | 0.42±0.03 | 0.42±0.03 |
Table 2 Ratio of carbon emissions to production in China’s marine capture fisheries from 2010 to 2019
省(自治区、直辖市) Province(antomomows region, municipality) | 天津Tianjin | 河北Hebei | 辽宁Liaoning | 上海Shanghai | 江苏Jiangsu | 浙江Zhejiang | 福建Fujian | 山东Shandong | 广东Guangdong | 广西Guangxi | 海南Hainan |
|---|---|---|---|---|---|---|---|---|---|---|---|
| 排放量/产量 Emissions/production | 0.72± 0.30 | 0.52± 0.05 | 0.57±0.22 | 3.15± 0.53 | 0.42±0.06 | 0.44±0.03 | 0.42±0.06 | 0.31±0.05 | 0.53± 0.02 | 0.42±0.03 | 0.42±0.03 |
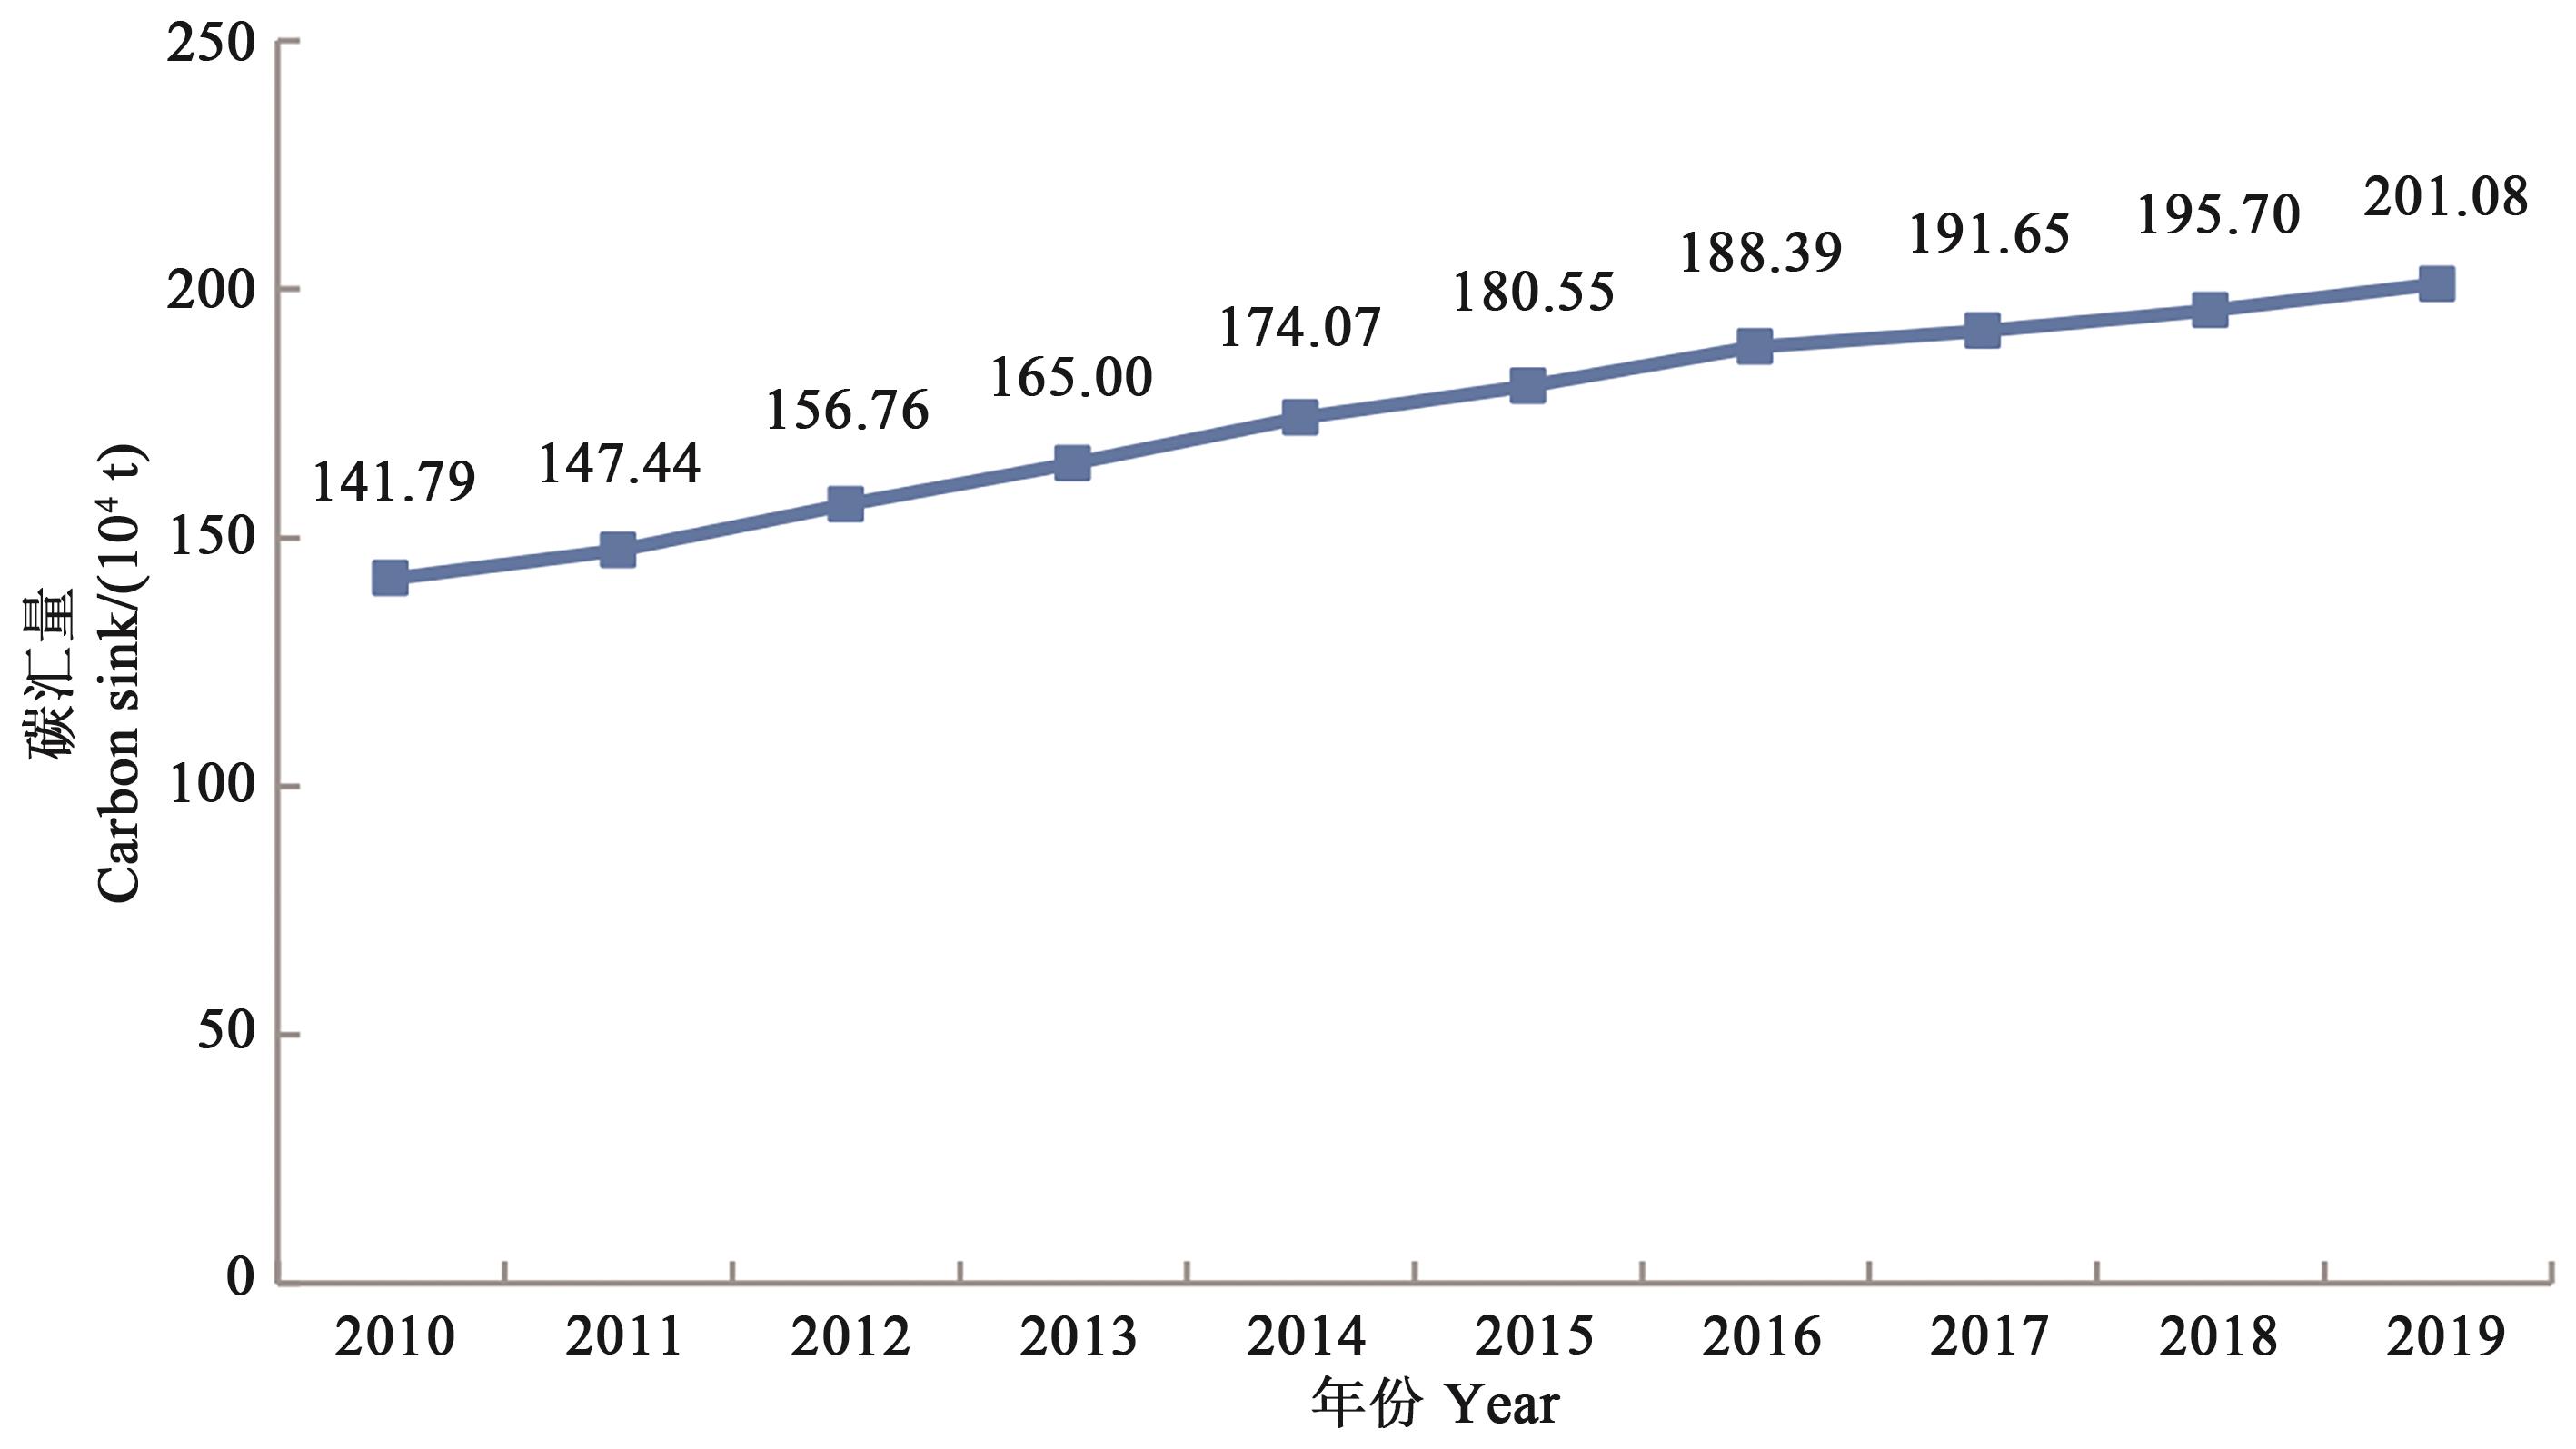
Fig. 3 Carbon sinks in China’s marine fisheries from 2010 to 2019
| 年份Year | 2010 | 2011 | 2012 | 2013 | 2014 | 2015 | 2016 | 2017 | 2018 | 2019 |
|---|---|---|---|---|---|---|---|---|---|---|
| 面积Area/(104 hm2) | 142.82 | 152.83 | 159.57 | 168.70 | 165.54 | 165.72 | 150.00 | 143.20 | 138.53 | 134.60 |
碳汇量 Carbon sinks/(t·hm-2) | 0.99 | 0.96 | 0.98 | 0.98 | 1.05 | 1.09 | 1.26 | 1.34 | 1.41 | 1.49 |
Table 3 Aquaculture area and carbon sink per unit area of marine shellfish and algae in China from 2010 to 2019
| 年份Year | 2010 | 2011 | 2012 | 2013 | 2014 | 2015 | 2016 | 2017 | 2018 | 2019 |
|---|---|---|---|---|---|---|---|---|---|---|
| 面积Area/(104 hm2) | 142.82 | 152.83 | 159.57 | 168.70 | 165.54 | 165.72 | 150.00 | 143.20 | 138.53 | 134.60 |
碳汇量 Carbon sinks/(t·hm-2) | 0.99 | 0.96 | 0.98 | 0.98 | 1.05 | 1.09 | 1.26 | 1.34 | 1.41 | 1.49 |
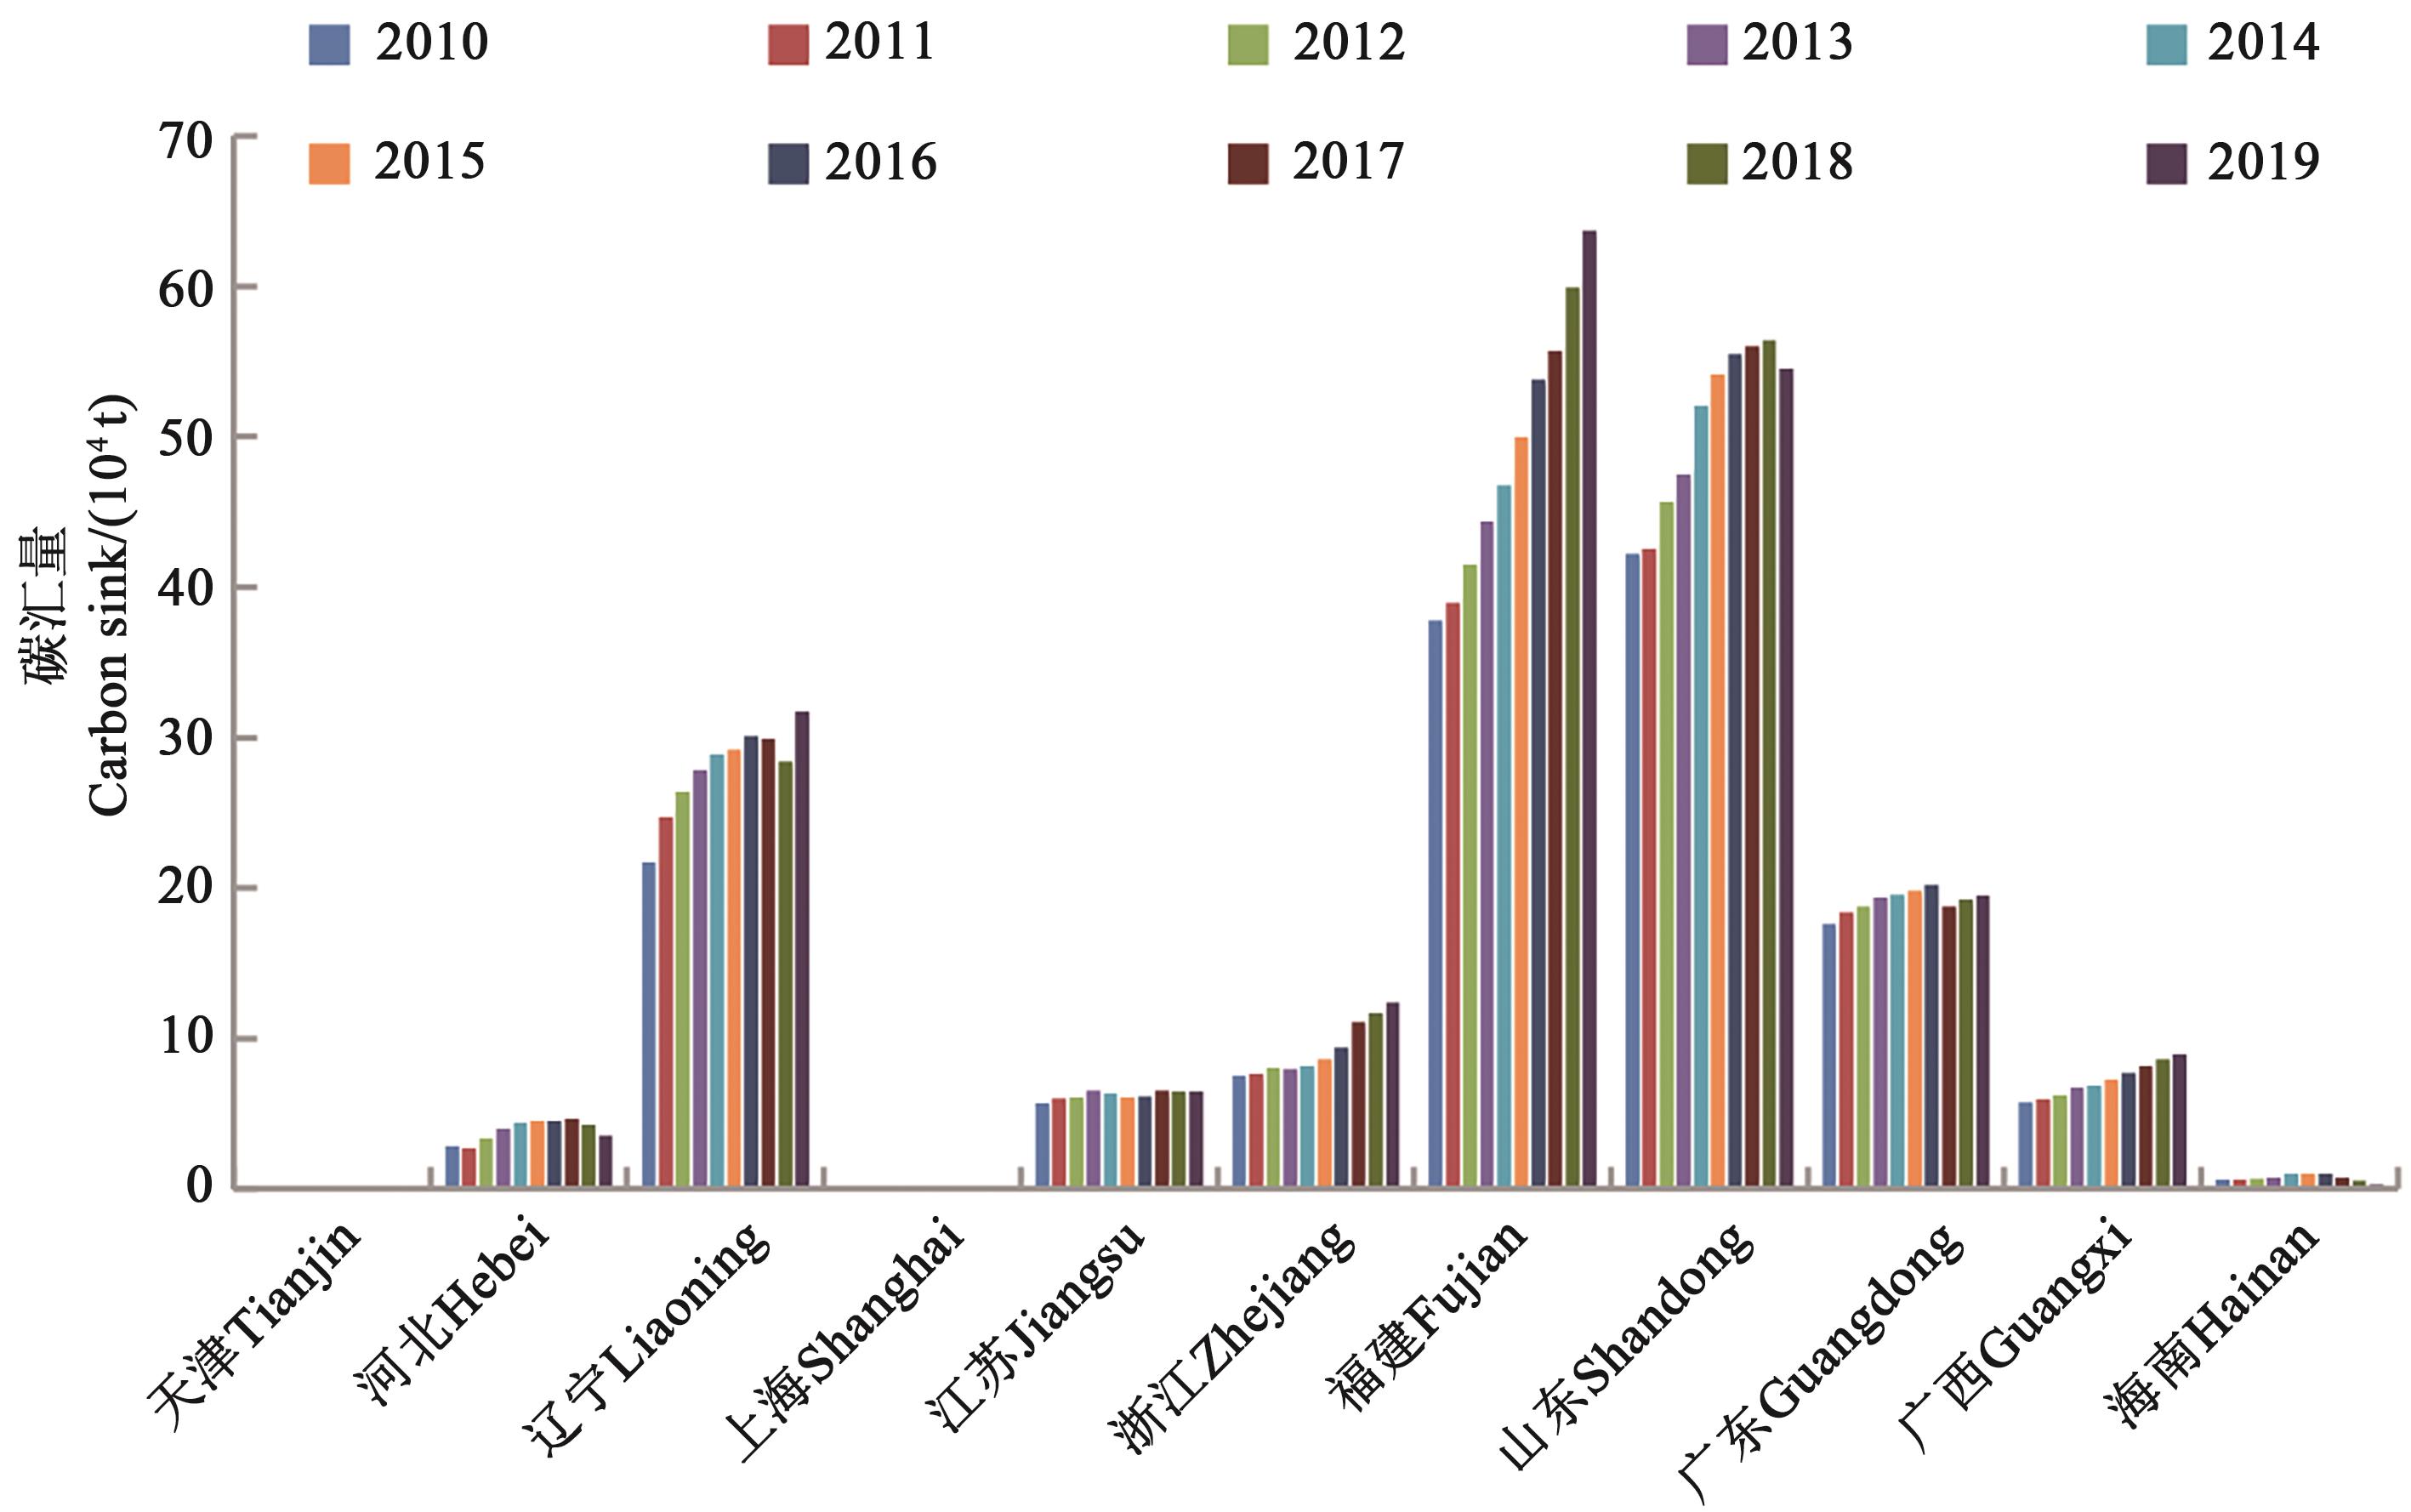
Fig. 4 Carbon sinks of provinces in China’s marine fisheries from 2010 to 2019
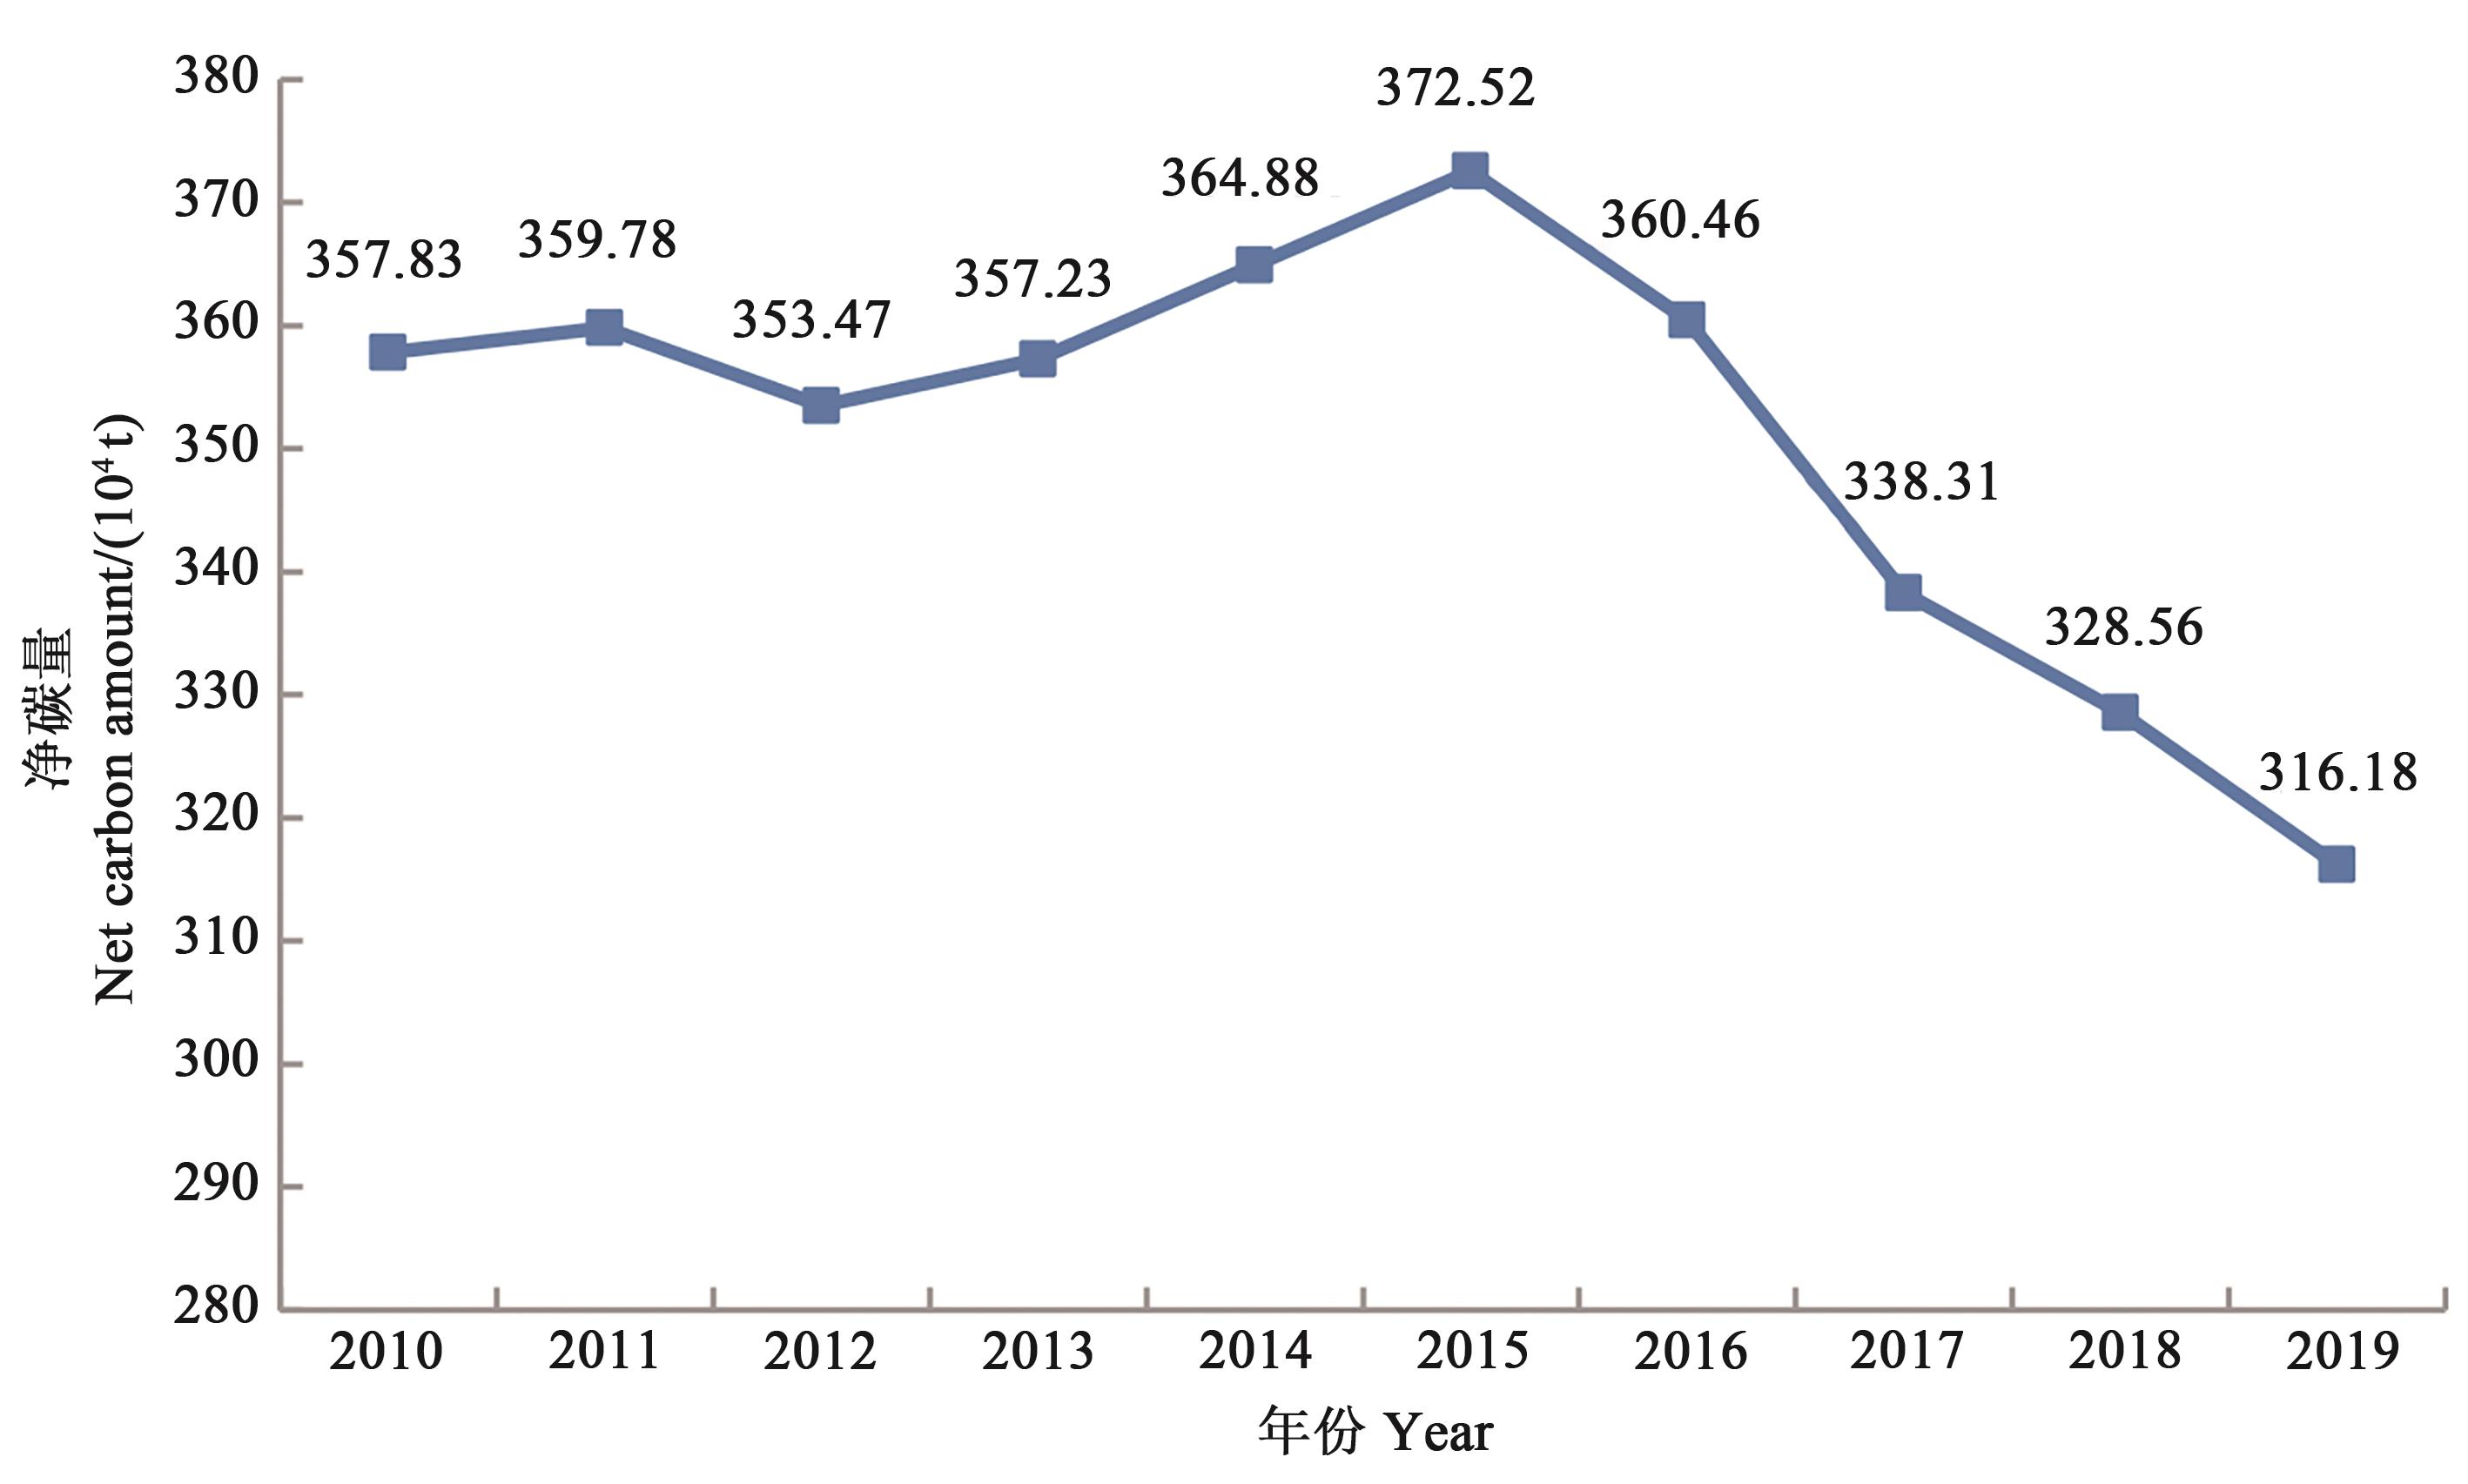
Fig. 5 Net carbon amount of China’s marine fisheries from 2010 to 2019
| 指标Index | 年份Year | |||
|---|---|---|---|---|
| 2015—2016 | 2016—2017 | 2017—2018 | 2018—2019 | |
减排 Carbon emission reduction/% | 35.06 | 85.26 | 58.50 | 56.48 |
增汇 Increase carbon sink/% | 64.94 | 14.74 | 41.50 | 43.52 |
Table 4 Contribution rate of emission reduction and sink increase to the improvement of China’s marine fishery carbon neutrality
| 指标Index | 年份Year | |||
|---|---|---|---|---|
| 2015—2016 | 2016—2017 | 2017—2018 | 2018—2019 | |
减排 Carbon emission reduction/% | 35.06 | 85.26 | 58.50 | 56.48 |
增汇 Increase carbon sink/% | 64.94 | 14.74 | 41.50 | 43.52 |
| 地区Region | 省市Province | 年份Year | |||||||||
|---|---|---|---|---|---|---|---|---|---|---|---|
| 2010 | 2011 | 2012 | 2013 | 2014 | 2015 | 2016 | 2017 | 2018 | 2019 | ||
| 北部海洋经济圈 Northern marine economic circle | 天津Tianjin | 1.48 | 1.67 | 2.10 | 1.97 | 1.85 | 2.06 | 2.15 | 2.15 | 2.03 | 2.00 |
| 河北Hebei | 9.26 | 9.13 | 7.95 | 8.40 | 8.52 | 8.81 | 7.65 | 7.05 | 7.44 | 8.53 | |
| 辽宁Liaoning | 24.36 | 21.32 | 20.03 | 17.80 | 17.31 | 21.79 | 15.50 | 14.37 | 18.73 | 13.94 | |
| 山东Shandong | 17.45 | 19.06 | 14.75 | 16.80 | 16.88 | 17.04 | 17.37 | 12.85 | 8.85 | 8.88 | |
| 合计Total | 52.55 | 51.18 | 44.83 | 44.96 | 44.56 | 49.70 | 42.67 | 36.42 | 37.05 | 33.34 | |
| 东部海洋经济圈 Eastern marine economic circle | 上海Shanghai | 5.56 | 5.64 | 5.65 | 5.41 | 5.70 | 5.65 | 5.27 | 5.22 | 5.36 | 5.13 |
| 江苏Jiangsu | 13.33 | 15.42 | 15.66 | 14.77 | 14.84 | 17.14 | 16.82 | 17.59 | 17.20 | 16.05 | |
| 浙江Zhejiang | 123.50 | 124.99 | 129.19 | 129.12 | 130.09 | 129.40 | 128.40 | 119.12 | 119.07 | 118.61 | |
| 合计Total | 142.40 | 146.06 | 150.51 | 149.30 | 150.63 | 152.19 | 150.49 | 141.93 | 141.64 | 139.78 | |
| 南部海洋经济圈 Southern marine economic circle | 福建Fujian | 27.76 | 27.76 | 26.80 | 30.86 | 31.97 | 34.34 | 30.62 | 26.05 | 23.20 | 20.84 |
| 广东Guangdong | 59.93 | 59.60 | 59.47 | 59.40 | 59.78 | 58.39 | 56.79 | 55.06 | 50.65 | 48.62 | |
| 广西Guangxi | 23.93 | 22.31 | 19.40 | 19.15 | 18.71 | 17.60 | 18.19 | 17.54 | 16.99 | 16.61 | |
| 海南Hainan | 41.72 | 43.19 | 43.40 | 44.22 | 49.70 | 50.73 | 52.18 | 51.21 | 50.26 | 48.33 | |
| 合计Total | 153.33 | 152.86 | 149.06 | 153.64 | 160.16 | 161.06 | 157.78 | 149.85 | 141.11 | 134.41 | |
Table 5 Net carbon amount of China’s marine fisheries from 2010 to 2019
| 地区Region | 省市Province | 年份Year | |||||||||
|---|---|---|---|---|---|---|---|---|---|---|---|
| 2010 | 2011 | 2012 | 2013 | 2014 | 2015 | 2016 | 2017 | 2018 | 2019 | ||
| 北部海洋经济圈 Northern marine economic circle | 天津Tianjin | 1.48 | 1.67 | 2.10 | 1.97 | 1.85 | 2.06 | 2.15 | 2.15 | 2.03 | 2.00 |
| 河北Hebei | 9.26 | 9.13 | 7.95 | 8.40 | 8.52 | 8.81 | 7.65 | 7.05 | 7.44 | 8.53 | |
| 辽宁Liaoning | 24.36 | 21.32 | 20.03 | 17.80 | 17.31 | 21.79 | 15.50 | 14.37 | 18.73 | 13.94 | |
| 山东Shandong | 17.45 | 19.06 | 14.75 | 16.80 | 16.88 | 17.04 | 17.37 | 12.85 | 8.85 | 8.88 | |
| 合计Total | 52.55 | 51.18 | 44.83 | 44.96 | 44.56 | 49.70 | 42.67 | 36.42 | 37.05 | 33.34 | |
| 东部海洋经济圈 Eastern marine economic circle | 上海Shanghai | 5.56 | 5.64 | 5.65 | 5.41 | 5.70 | 5.65 | 5.27 | 5.22 | 5.36 | 5.13 |
| 江苏Jiangsu | 13.33 | 15.42 | 15.66 | 14.77 | 14.84 | 17.14 | 16.82 | 17.59 | 17.20 | 16.05 | |
| 浙江Zhejiang | 123.50 | 124.99 | 129.19 | 129.12 | 130.09 | 129.40 | 128.40 | 119.12 | 119.07 | 118.61 | |
| 合计Total | 142.40 | 146.06 | 150.51 | 149.30 | 150.63 | 152.19 | 150.49 | 141.93 | 141.64 | 139.78 | |
| 南部海洋经济圈 Southern marine economic circle | 福建Fujian | 27.76 | 27.76 | 26.80 | 30.86 | 31.97 | 34.34 | 30.62 | 26.05 | 23.20 | 20.84 |
| 广东Guangdong | 59.93 | 59.60 | 59.47 | 59.40 | 59.78 | 58.39 | 56.79 | 55.06 | 50.65 | 48.62 | |
| 广西Guangxi | 23.93 | 22.31 | 19.40 | 19.15 | 18.71 | 17.60 | 18.19 | 17.54 | 16.99 | 16.61 | |
| 海南Hainan | 41.72 | 43.19 | 43.40 | 44.22 | 49.70 | 50.73 | 52.18 | 51.21 | 50.26 | 48.33 | |
| 合计Total | 153.33 | 152.86 | 149.06 | 153.64 | 160.16 | 161.06 | 157.78 | 149.85 | 141.11 | 134.41 | |
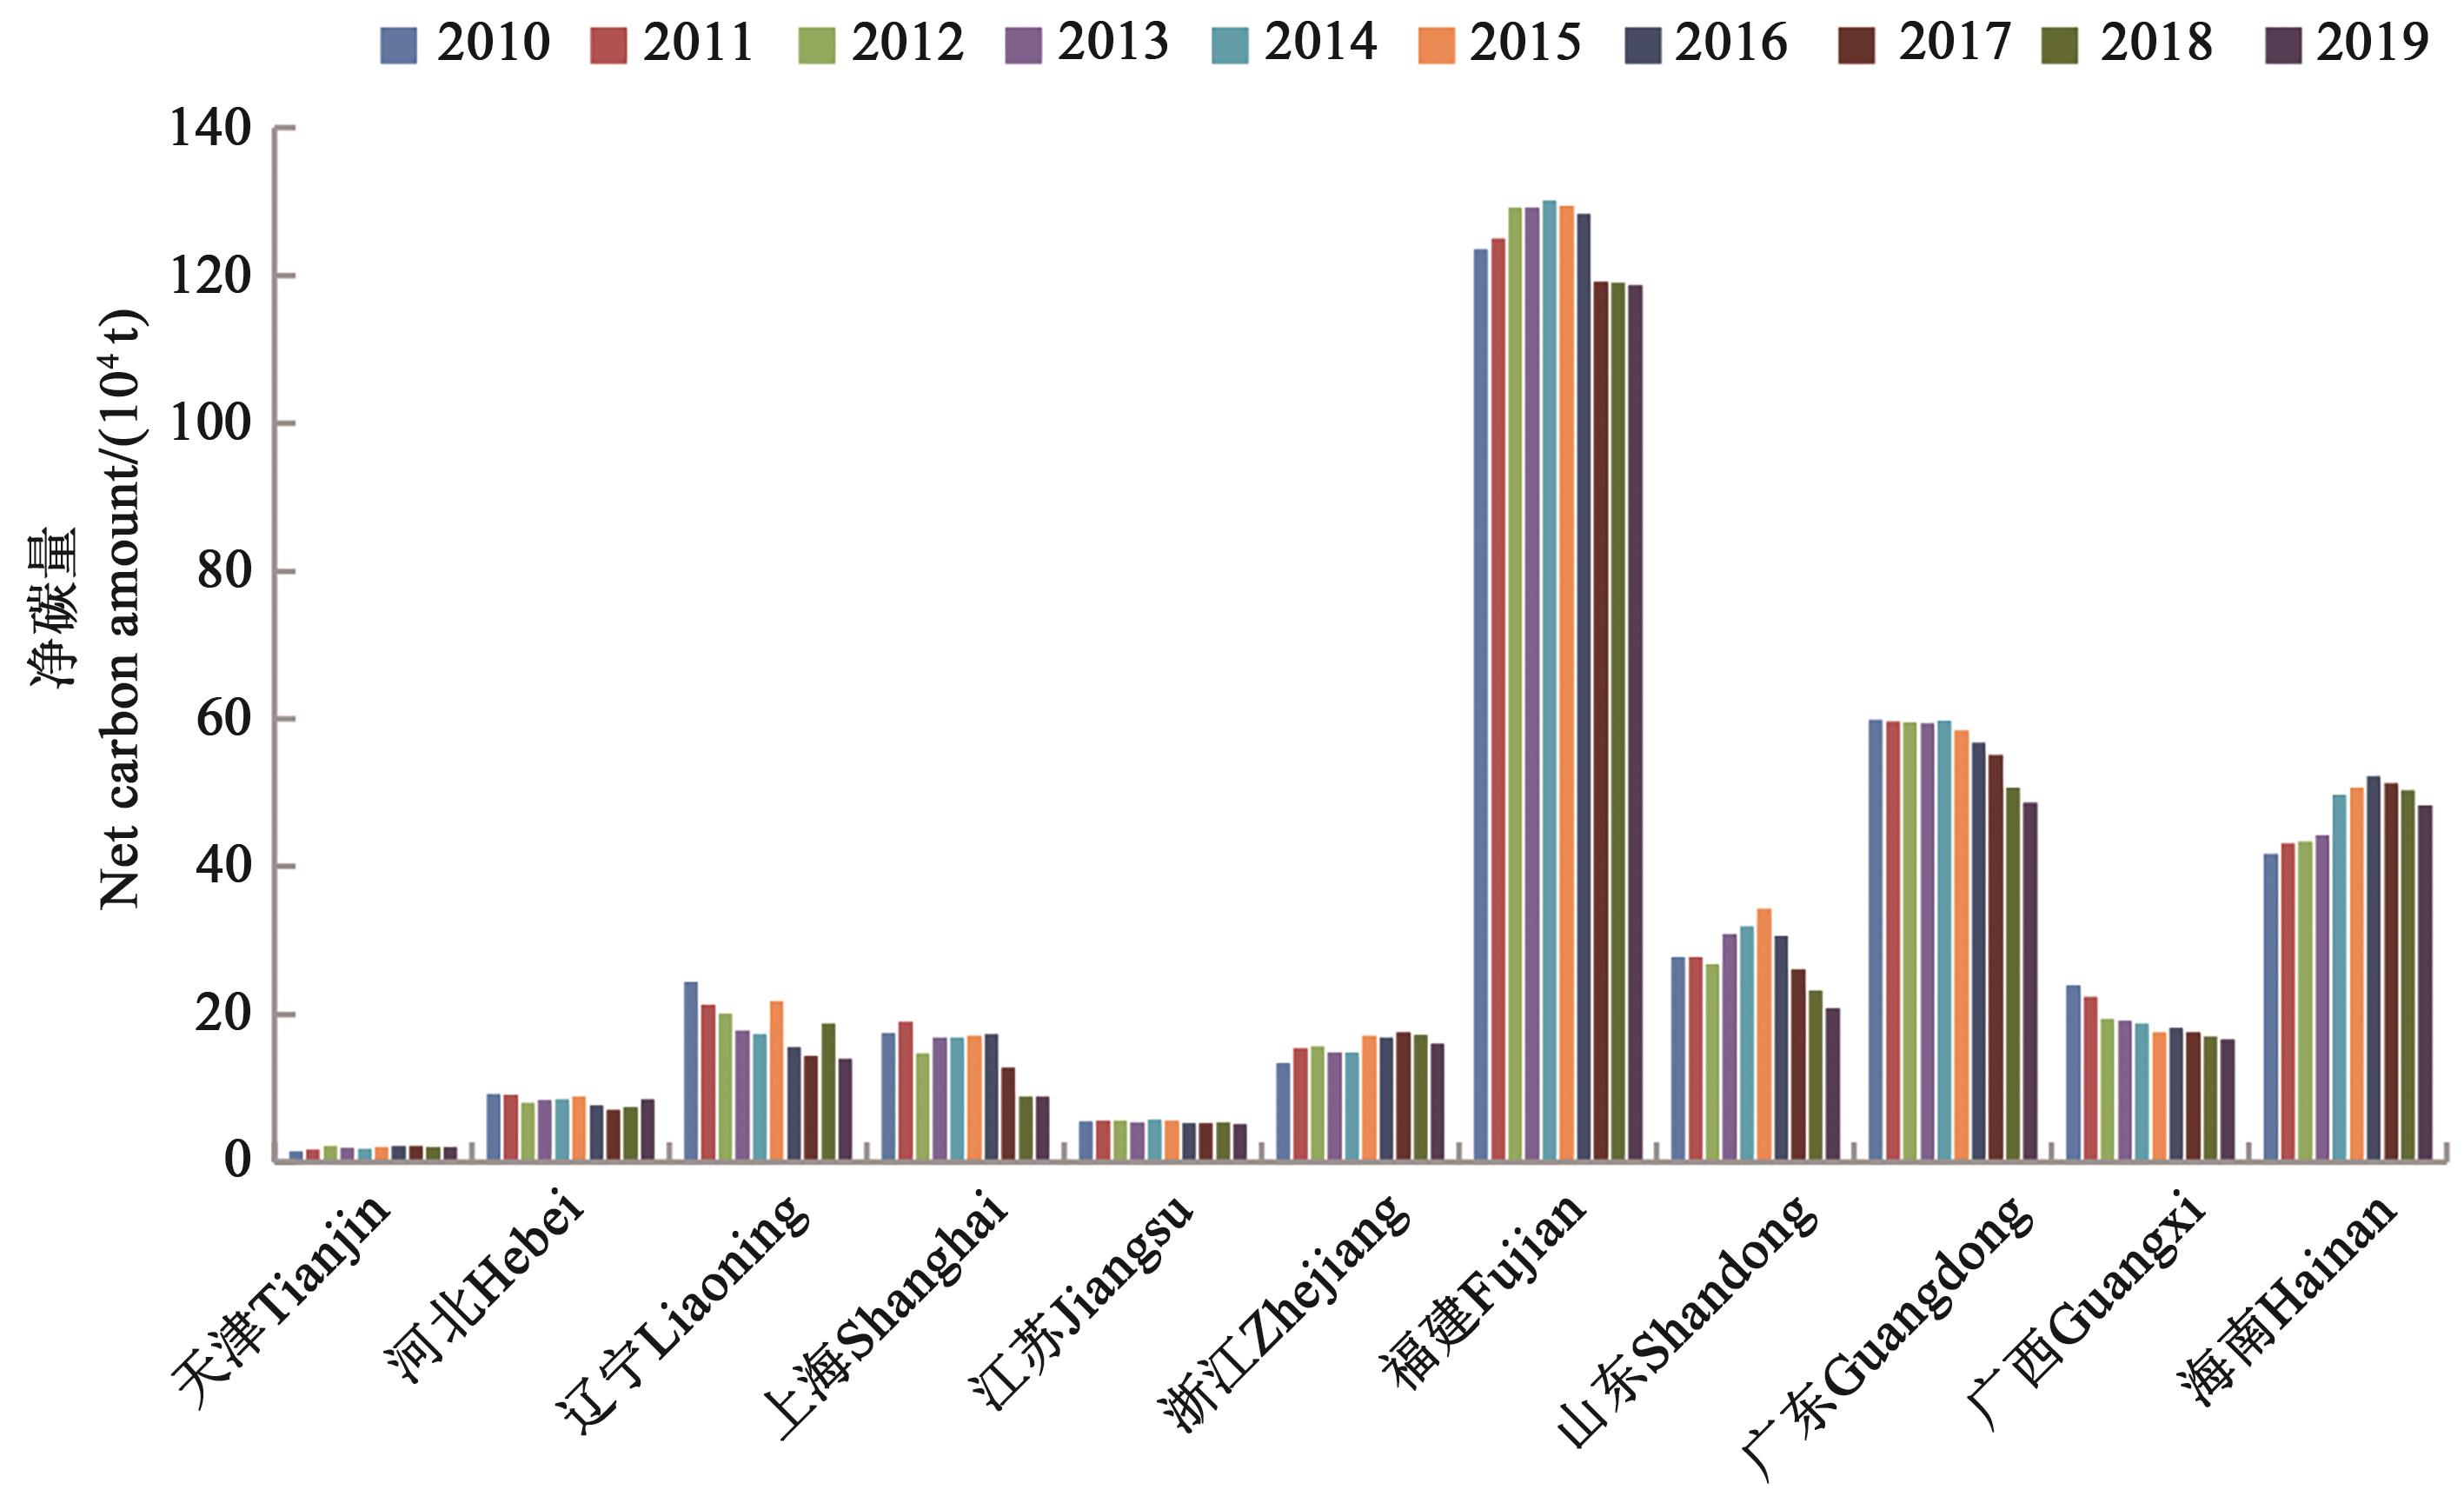
Fig. 6 Provincial results of China’s marine fishery net carbon amount from 2010 to 2019
| 1 | 唐启升. 碳汇渔业与又好又快发展现代渔业[J]. 江西水产科技, 2011(2): 5-7. |
| TANG Q S. Carbon sinks fisheries and fast development of modern fisheries [J]. Jiangxi Fish. Sci., 2011(2):5-7. | |
| 2 | 徐皓, 刘晃, 张建华, 等. 我国渔业能源消耗测算[J]. 中国水产, 2007(11): 74-76, 78. |
| 3 | 徐皓. 我国渔业节能减排基本情况研究报告[J]. 渔业现代化, 2008(4): 1-7. |
| XU H. Report on fishery industry energy conservation and emissions reduction research in China [J]. Fish. Modern., 2008(4):1-7. | |
| 4 | 张祝利, 王玮, 何雅萍. 我国渔船作业过程碳排放的估算[J].上海海洋大学学报, 2010,19(6): 848-852. |
| ZHANG Z L, WANG W, HE Y P. The calculation of emissions of carbon during the process of fishing boats operations in China [J]. J. Shanghai Ocean Univ., 2010, 19(6): 848-852. | |
| 5 | 岳冬冬, 王鲁民, 阮雯, 等. 中国海洋捕捞渔业温室气体排放时序分析与因素分解[J]. 长江流域资源与环境, 2014, 23(8): 1057-1063. |
| YUE D D, WANG L M, RUAN W, et al.. Time series analysis and factor decomposition of greenhouse gas emissions of marine fishing in China [J]. Resour. Environ. Yangtze Basin., 2014, 23(8): 1057-1063. | |
| 6 | 徐皓, 张祝利, 赵平. 我国渔船耗能调查与分析[J]. 中国水产, 2009(9): 5-7. |
| 7 | 岳冬冬, 王鲁民, 王茜, 等. 我国海洋捕捞渔业温室气体排放量估算与效率分析[J]. 山西农业科学, 2013, 41(8):873-876. |
| YUE D D, WANG L M, WANG Q, et al.. GHG emissions estimation and efficiency analysis of marine fisheries [J]. J. Shanxi Agric. Sci., 2013, 41(8):873-876. | |
| 8 | 邵桂兰, 孔海峥, 于谨凯, 等. 基于LMDI法的我国海洋渔业碳排放驱动因素分解研究[J]. 农业技术经济, 2015(6): 119-128. |
| 9 | 岳冬冬, 王鲁民, 方海, 等. 基于碳平衡的中国海洋渔业产业发展对策探析[J]. 中国农业科技导报, 2016, 18(4): 1-8. |
| YUE D D, WANG L M, FANG H, et al.. Development strategy of marine fisheries in China based on the carbon balance [J]. J. Agric. Sci. Technol., 2016, 18(4):1-8. | |
| 10 | 齐占会, 王珺, 黄洪辉, 等. 广东省海水养殖贝藻类碳汇潜力评估[J]. 南方水产科学, 2012, 8(1): 30-35. |
| QI Z H, WANG J, HUANG H H, et al.. Potential assessment of carbon sink capacity by marine bivalves and seaweeds in Guangdong province [J]. South China Fish. Sci., 2012, 8(1):30-35. | |
| 11 | 李昂, 刘存歧, 董梦荟, 等. 河北省海水养殖贝类与藻类碳汇能力评估[J]. 南方农业学报, 2013, 44(7): 1201-1204. |
| LI A, LIU C Q, DONG M H, et al.. Assessing carbon sink capacity of marine bivalves and seaweeds in Hebei province [J]. J. South. Agric., 2013, 44(7): 1201-1204. | |
| 12 | 权伟, 应苗苗, 康华靖, 等. 中国近海海藻养殖及碳汇强度估算[J]. 水产学报, 2014, 38(4): 509-514. |
| QUAN W, YING M M, KANG H J, et al.. Marine algae culture and the estimation of carbon sink capacity in the coastal areas of China [J]. J. Fish. China, 2014, 38(4): 509-514. | |
| 13 | 纪建悦, 王萍萍. 我国海水养殖业碳汇能力测度及其影响因素分解研究[J]. 海洋环境科学, 2015, 34(6): 871-878. |
| JI J Y, WANG P P. Research on China’s mariculture carbon sink capacity and influencing factors [J]. Mar. Environ. Sci., 2015, 36(6): 871-878. | |
| 14 | 孙吉亭, 赵玉杰. 我国碳汇渔业发展模式研究[J].东岳论丛,2011,32(8): 150-155. |
| SUN J T, ZHAO Y J. Developing patterns of fishery carbon sink of China [J]. Dongyue Tribune, 2011, 32(8): 150-155. | |
| 15 | 唐启升, 刘慧. 海洋渔业碳汇及其扩增战略[J]. 中国工程科学, 2016, 18(3): 68-73. |
| TANG Q S, LIU H. Strategy for carbon sink and its amplification in marine fisheries [J]. Strategic Study CAE, 2016, 18(3): 68-73. | |
| 16 | 邵桂兰, 褚蕊, 李晨. 基于碳排放和碳汇核算的海洋渔业碳平衡研究——以山东省为例[J]. 中国渔业经济, 2018, 36(4):4-13. |
| SHAO G L, CHU R, LI C. Research on carbon balance of marine fishery in Shandong province using the calculation results of carbon emission and carbon sink [J]. Chin. Fish. Econ., 2018, 36(4): 4-13. | |
| 17 | 邵桂兰, 孔海峥, 李晨. 中国海水养殖的净碳汇及其与经济耦合关系[J]. 资源科学, 2019,41(2): 277-288. |
| SHAO G L, KONG H Z, LI C. Net amount of mariculture carbon sink and its coupling relationship with economics growth of China [J]. Resour. Sci., 2019, 41(2): 277-288. | |
| 18 | 邓旭, 谢俊, 滕飞. 何谓“碳中和”?[J]. 气候变化研究进展,2021, 17(1): 107-113. |
| DENG X, XIE J, TENG F. What is carbon neutrality? [J]. Adv. Climate Change Res., 2021, 17(1): 107-113. | |
| 19 | 杜祥琬. 试论碳达峰与碳中和[J]. 人民论坛·学术前沿, 2021(14): 22-27, 143. |
| 20 | 岳冬冬, 王鲁民. 基于直接碳汇核算的长三角地区海水贝类养殖发展分析[J]. 山东农业科学, 2012, 44(8): 133-136. |
| YUE D D, WANG L M. Development analysis of shellfish aquaculture in the Yangtze River Delta region based on the principle of direct carbon sinks accounting [J]. Shandong Agric. Sci., 2012, 44(8): 133-136. | |
| 21 | 张继红, 方建光, 唐启升. 中国浅海贝藻养殖对海洋碳循环的贡献[J]. 地球科学进展, 2005(3): 359-365. |
| ZHANG J H, FANG J G, TANG Q S. The contribution of shellfish and seaweed in China to the carbon recycle of coastal ecosystem [J]. Adv. Earth Sci., 2005(3): 359-365. | |
| 22 | GAO K S, MCKINLEY K R. Use of macroalgae for marine biomass production and CO2 remediation: a review [J]. J. Appl. Phycol., 1994, 6(1): 45-60. |
| 23 | 周毅, 杨红生, 刘石林, 等. 烟台四十里湾浅海养殖生物及附着生物的化学组成、有机净生产量及其生态效应[J]. 水产学报, 2002(1): 21-27. |
| ZHOU Y, YANG H S, LIU S L, et al.. Chemical composition and net organic production of cultivated and fouling organisms in Sishili Bay and their ecological effects [J]. J. Fish. China, 2002(1): 21-27. | |
| 24 | 纪建悦, 王萍萍. 我国海水养殖藻类碳汇能力及影响因素研究[J]. 中国海洋大学学报(社会科学版), 2014(4): 17-20. |
| JI J Y, WANG P P. A study on carbon capacity and its influencing factors of marine cultured alage in China [J]. Periodical Ocean Univ. China (Soc. Sci.), 2014(4): 17-20. |
| [1] | YUE Dong-dong1, WANG Lu-min1*, FANG Hai1, GENG Rui2, ZHAO Peng-fei2, . Development Strategy of Marine Fisheries in China Based on the Carbon Balance [J]. Journal of Agricultural Science and Technology, 2016, 18(4): 1-8. |
| [2] | YUE Dong\|dong1, WANG Lu\|min1*, ZHANG Xun1, ZHENG Han\|feng1, FENG Chun\|lei1, . Studies on Assessment of Carbon Sinks of Indian Ocean Tuna Fishery ——Taking China for Example [J]. , 2014, 16(5): 132-138. |
| Viewed | ||||||
|
Full text |
|
|||||
|
Abstract |
|
|||||
 京公网安备11010802021197号