


中国农业科技导报 ›› 2025, Vol. 27 ›› Issue (3): 172-182.DOI: 10.13304/j.nykjdb.2023.0695
• 生物制造 资源生态 • 上一篇
米洋辰( ), 赵政, 王呈玉, 闫丽娜, 冯秋苹, 刘淑霞, 刘世杰()
收稿日期:2023-09-18
接受日期:2024-03-28
出版日期:2025-03-15
发布日期:2025-03-14
通讯作者:
刘世杰
作者简介:米洋辰 E-mail: 1260345053@qq.com;
基金资助:
Yangchen MI(), Zheng ZHAO, Chengyu WANG, Lina YAN, Qiuping FENG, Shuxia LIU, Shijie LIU()
Received:2023-09-18
Accepted:2024-03-28
Online:2025-03-15
Published:2025-03-14
Contact:
Shijie LIU
摘要:
为选择有效的秸秆还田方式,通过长期定位试验和室内分析相结合的方式探究不同秸秆还田方式下土壤水分特征曲线变化。设置常规耕作(CK)、秸秆翻埋(SO)、秸秆轮耕还田(SR)、秸秆碎混还田(SCM)、秸秆覆盖还田(SM)、秸秆留高茬还田(HSR)、秸秆条带还田(SP)共7个处理,通过水分特征曲线适宜模型的筛选、土壤水分常数及比水容量等的测定,研究秸秆还田方式对土壤持水性能的影响。结果表明,利用Gardner、Rational和指数模型将实测的数据进行拟合,Gardner方程拟合效果好,均方根误差、绝对平均误差、相对误差较小,决定系数(R2)均大于0.990 0,可以作为适宜的土壤水分曲线模型。通过土壤水分特征曲线方程发现,土壤水吸力在压力膜仪内低吸力时土壤含水量最高,随着压力值的不断增大,土壤水分含量呈降低趋势,曲线的高度代表土壤持水能力的大小,各处理在0—20 cm耕层表现为SO>SR>SCM>SM>HSR>SP>CK,在20—40 cm犁底层表现为SO>SCM>SR>SM>HSR>SP>CK,秸秆还田处理与CK相比均有增大,SO处理在各土层的持水性较高。秸秆还田可以提升土壤持水性能,其中,SO处理水分特征曲线较高,土壤持水能力最好,可作为适合东北西部地区适宜的秸秆还田方式。
中图分类号:
米洋辰, 赵政, 王呈玉, 闫丽娜, 冯秋苹, 刘淑霞, 刘世杰. 不同秸秆还田方式对土壤水分特征曲线的影响[J]. 中国农业科技导报, 2025, 27(3): 172-182.
Yangchen MI, Zheng ZHAO, Chengyu WANG, Lina YAN, Qiuping FENG, Shuxia LIU, Shijie LIU. Influence of Straw Returning Method on Soil Moisture Curve[J]. Journal of Agricultural Science and Technology, 2025, 27(3): 172-182.
土层 Soil layer/cm | 参数 Parameter | 处理 Treatment | |||||||
|---|---|---|---|---|---|---|---|---|---|
| CK | SO | SR | SCM | SM | HSR | SP | |||
| 0—20 | a | 0.200 3 | 0.437 4 | 0.372 0 | 0.404 9 | 0.325 1 | 0.251 3 | 0.237 3 | |
| b | 0.361 2 | 0.123 3 | 0.215 4 | 0.240 0 | 0.390 7 | 0.321 4 | 0.326 0 | ||
| 决定系数R2 | 0.987 0 | 0.997 6 | 0.998 1 | 0.995 6 | 0.980 7 | 0.986 8 | 0.975 6 | ||
| 20—40 | a | 0.173 4 | 0.444 4 | 0.360 4 | 0.324 7 | 0.289 2 | 0.279 9 | 0.216 0 | |
| b | 0.409 9 | 0.164 3 | 0.232 8 | 0.347 9 | 0.370 8 | 0.387 5 | 0.330 2 | ||
| 决定系数R2 | 0.943 3 | 0.963 7 | 0.976 7 | 0.998 2 | 0.981 0 | 0.967 6 | 0.944 8 | ||
表1 Gardner水分特征曲线方程参数
Table 1 Gardner moisture characteristic curve equation parameters
土层 Soil layer/cm | 参数 Parameter | 处理 Treatment | |||||||
|---|---|---|---|---|---|---|---|---|---|
| CK | SO | SR | SCM | SM | HSR | SP | |||
| 0—20 | a | 0.200 3 | 0.437 4 | 0.372 0 | 0.404 9 | 0.325 1 | 0.251 3 | 0.237 3 | |
| b | 0.361 2 | 0.123 3 | 0.215 4 | 0.240 0 | 0.390 7 | 0.321 4 | 0.326 0 | ||
| 决定系数R2 | 0.987 0 | 0.997 6 | 0.998 1 | 0.995 6 | 0.980 7 | 0.986 8 | 0.975 6 | ||
| 20—40 | a | 0.173 4 | 0.444 4 | 0.360 4 | 0.324 7 | 0.289 2 | 0.279 9 | 0.216 0 | |
| b | 0.409 9 | 0.164 3 | 0.232 8 | 0.347 9 | 0.370 8 | 0.387 5 | 0.330 2 | ||
| 决定系数R2 | 0.943 3 | 0.963 7 | 0.976 7 | 0.998 2 | 0.981 0 | 0.967 6 | 0.944 8 | ||
土层 Soil layer/cm | 压力 Pressure/Pa | 相对误差 Relative error/% | ||||||
|---|---|---|---|---|---|---|---|---|
| CK | SO | SR | SCM | SM | HSR | SP | ||
| 0.0 | 1.17 | 0.03 | 1.95 | 1.98 | 2.35 | 2.83 | 4.79 | |
| 1.0×10⁵ | 0.91 | 0.05 | 0.48 | 0.73 | 1.97 | 1.51 | 2.10 | |
| 0—20 | 3.0×10⁵ | 1.23 | 1.09 | 0.96 | 1.37 | 7.96 | 3.54 | 7.38 |
| 5.0×10⁵ | 6.51 | 0.13 | 0.79 | 0.45 | 0.58 | 3.91 | 0.55 | |
| 1.0×10⁶ | 7.06 | 0.08 | 1.14 | 1.06 | 3.40 | 2.08 | 4.16 | |
| 1.5×10⁶ | 1.71 | 0.65 | 0.52 | 0.68 | 8.02 | 6.48 | 4.73 | |
| 0.0 | 1.37 | 0.04 | 4.18 | 1.68 | 3.11 | 1.39 | 6.62 | |
| 1.0×10⁵ | 3.17 | 1.79 | 0.33 | 0.25 | 1.63 | 2.22 | 1.74 | |
| 20—40 | 3.0×10⁵ | 3.68 | 3.32 | 5.50 | 1.80 | 8.03 | 10.98 | 10.09 |
| 5.0×10⁵ | 8.93 | 3.13 | 2.41 | 2.08 | 3.19 | 3.56 | 9.40 | |
| 1.0×10⁶ | 2.52 | 2.28 | 2.42 | 0.58 | 3.52 | 5.90 | 5.71 | |
| 1.5×10⁶ | 24.34 | 2.97 | 2.25 | 0.18 | 2.47 | 3.40 | 6.30 | |
表2 Gardner方程实测值与拟合值的相对误差
Table 2 Relative errors between measured and fitted values of the Gardner equation
土层 Soil layer/cm | 压力 Pressure/Pa | 相对误差 Relative error/% | ||||||
|---|---|---|---|---|---|---|---|---|
| CK | SO | SR | SCM | SM | HSR | SP | ||
| 0.0 | 1.17 | 0.03 | 1.95 | 1.98 | 2.35 | 2.83 | 4.79 | |
| 1.0×10⁵ | 0.91 | 0.05 | 0.48 | 0.73 | 1.97 | 1.51 | 2.10 | |
| 0—20 | 3.0×10⁵ | 1.23 | 1.09 | 0.96 | 1.37 | 7.96 | 3.54 | 7.38 |
| 5.0×10⁵ | 6.51 | 0.13 | 0.79 | 0.45 | 0.58 | 3.91 | 0.55 | |
| 1.0×10⁶ | 7.06 | 0.08 | 1.14 | 1.06 | 3.40 | 2.08 | 4.16 | |
| 1.5×10⁶ | 1.71 | 0.65 | 0.52 | 0.68 | 8.02 | 6.48 | 4.73 | |
| 0.0 | 1.37 | 0.04 | 4.18 | 1.68 | 3.11 | 1.39 | 6.62 | |
| 1.0×10⁵ | 3.17 | 1.79 | 0.33 | 0.25 | 1.63 | 2.22 | 1.74 | |
| 20—40 | 3.0×10⁵ | 3.68 | 3.32 | 5.50 | 1.80 | 8.03 | 10.98 | 10.09 |
| 5.0×10⁵ | 8.93 | 3.13 | 2.41 | 2.08 | 3.19 | 3.56 | 9.40 | |
| 1.0×10⁶ | 2.52 | 2.28 | 2.42 | 0.58 | 3.52 | 5.90 | 5.71 | |
| 1.5×10⁶ | 24.34 | 2.97 | 2.25 | 0.18 | 2.47 | 3.40 | 6.30 | |
土层 Soil layer/cm | 参数 Parameter | 处理 Treatment | ||||||
|---|---|---|---|---|---|---|---|---|
| CK | SO | SR | SCM | SM | HSR | SP | ||
| 0—20 | a | 0.256 17 | 0.583 23 | 0.523 40 | 0.548 29 | 0.456 86 | 0.392 38 | 0.305 60 |
| b | 0.006 46 | 0.441 44 | 0.208 50 | 0.141 64 | 0.108 88 | 0.266 58 | 0.014 06 | |
| c | 0.335 32 | 1.327 67 | 0.951 50 | 0.699 74 | 0.726 52 | 1.570 95 | 0.387 55 | |
| 决定系数R2 | 0.993 61 | 0.999 04 | 0.999 80 | 0.997 60 | 0.998 10 | 0.999 89 | 0.973 01 | |
| 20—40 | a | 0.230 00 | 0.603 28 | 0.528 40 | 0.487 77 | 0.402 64 | 0.355 00 | 0.267 27 |
| b | 0.029 80 | 0.979 93 | 0.199 40 | 0.088 77 | 0.036 10 | -0.012 50 | -0.004 31 | |
| c | 0.552 48 | 2.542 92 | 1.003 60 | 0.768 47 | 0.517 19 | 0.253 09 | 0.237 93 | |
| 决定系数R2 | 0.995 90 | 0.996 36 | 0.992 50 | 0.999 49 | 0.994 72 | 0.993 02 | 0.978 50 | |
表3 Rational水分特征曲线方程参数
Table 3 Rational moisture characteristic curve equation parameters
土层 Soil layer/cm | 参数 Parameter | 处理 Treatment | ||||||
|---|---|---|---|---|---|---|---|---|
| CK | SO | SR | SCM | SM | HSR | SP | ||
| 0—20 | a | 0.256 17 | 0.583 23 | 0.523 40 | 0.548 29 | 0.456 86 | 0.392 38 | 0.305 60 |
| b | 0.006 46 | 0.441 44 | 0.208 50 | 0.141 64 | 0.108 88 | 0.266 58 | 0.014 06 | |
| c | 0.335 32 | 1.327 67 | 0.951 50 | 0.699 74 | 0.726 52 | 1.570 95 | 0.387 55 | |
| 决定系数R2 | 0.993 61 | 0.999 04 | 0.999 80 | 0.997 60 | 0.998 10 | 0.999 89 | 0.973 01 | |
| 20—40 | a | 0.230 00 | 0.603 28 | 0.528 40 | 0.487 77 | 0.402 64 | 0.355 00 | 0.267 27 |
| b | 0.029 80 | 0.979 93 | 0.199 40 | 0.088 77 | 0.036 10 | -0.012 50 | -0.004 31 | |
| c | 0.552 48 | 2.542 92 | 1.003 60 | 0.768 47 | 0.517 19 | 0.253 09 | 0.237 93 | |
| 决定系数R2 | 0.995 90 | 0.996 36 | 0.992 50 | 0.999 49 | 0.994 72 | 0.993 02 | 0.978 50 | |
土层 Soil layer/cm | 压力 Pressure/Pa | 相对误差 Relative error/% | ||||||
|---|---|---|---|---|---|---|---|---|
| CK | SO | SR | SCM | SM | HSR | SP | ||
| 0.0 | 0.06 | 0.02 | 0.01 | 0.08 | 0.08 | 0.02 | 0.99 | |
| 1.0×10⁵ | 0.55 | 0.24 | 6.27 | 0.76 | 0.43 | 0.02 | 2.01 | |
| 0—20 | 3.0×10⁵ | 1.55 | 0.57 | 0.28 | 2.16 | 2.67 | 11.03 | 3.55 |
| 5.0×10⁵ | 5.10 | 1.14 | 3.93 | 1.48 | 6.08 | 13.24 | 18.42 | |
| 1.0×10⁶ | 2.23 | 0.44 | 0.73 | 4.20 | 0.31 | 1.00 | 32.57 | |
| 1.5×10⁶ | 17.77 | 2.99 | 0.44 | 0.77 | 1.42 | 0.89 | 29.72 | |
| 0.0 | 0.09 | 0.01 | 0.19 | 0.03 | 0.24 | 0.59 | 0.04 | |
| 1.0×10⁵ | 0.18 | 0.26 | 0.86 | 0.18 | 5.02 | 1.12 | 0.76 | |
| 20—40 | 3.0×10⁵ | 0.25 | 1.06 | 5.05 | 3.01 | 4.60 | 4.90 | 7.15 |
| 5.0×10⁵ | 4.03 | 0.13 | 2.28 | 1.60 | 3.68 | 1.32 | 8.10 | |
| 1.0×10⁶ | 3.50 | 2.51 | 1.54 | 1.14 | 1.34 | 8.03 | 4.72 | |
| 1.5×10⁶ | 3.05 | 1.92 | 3.27 | 0.42 | 1.06 | 0.50 | 0.79 | |
表4 Rational方程实测值与拟合值的相对误差
Table 4 Relative errors between measured and fitted values of the Rational equation
土层 Soil layer/cm | 压力 Pressure/Pa | 相对误差 Relative error/% | ||||||
|---|---|---|---|---|---|---|---|---|
| CK | SO | SR | SCM | SM | HSR | SP | ||
| 0.0 | 0.06 | 0.02 | 0.01 | 0.08 | 0.08 | 0.02 | 0.99 | |
| 1.0×10⁵ | 0.55 | 0.24 | 6.27 | 0.76 | 0.43 | 0.02 | 2.01 | |
| 0—20 | 3.0×10⁵ | 1.55 | 0.57 | 0.28 | 2.16 | 2.67 | 11.03 | 3.55 |
| 5.0×10⁵ | 5.10 | 1.14 | 3.93 | 1.48 | 6.08 | 13.24 | 18.42 | |
| 1.0×10⁶ | 2.23 | 0.44 | 0.73 | 4.20 | 0.31 | 1.00 | 32.57 | |
| 1.5×10⁶ | 17.77 | 2.99 | 0.44 | 0.77 | 1.42 | 0.89 | 29.72 | |
| 0.0 | 0.09 | 0.01 | 0.19 | 0.03 | 0.24 | 0.59 | 0.04 | |
| 1.0×10⁵ | 0.18 | 0.26 | 0.86 | 0.18 | 5.02 | 1.12 | 0.76 | |
| 20—40 | 3.0×10⁵ | 0.25 | 1.06 | 5.05 | 3.01 | 4.60 | 4.90 | 7.15 |
| 5.0×10⁵ | 4.03 | 0.13 | 2.28 | 1.60 | 3.68 | 1.32 | 8.10 | |
| 1.0×10⁶ | 3.50 | 2.51 | 1.54 | 1.14 | 1.34 | 8.03 | 4.72 | |
| 1.5×10⁶ | 3.05 | 1.92 | 3.27 | 0.42 | 1.06 | 0.50 | 0.79 | |
土层 Soil layer/cm | 参数 Parameter | 处理 Treatment | ||||||
|---|---|---|---|---|---|---|---|---|
| CK | SO | SR | SCM | SM | HSR | SP | ||
| 0—20 | a | 0.075 38 | 0.305 64 | 0.255 10 | 0.228 54 | 0.114 64 | 0.116 40 | 0.108 70 |
| b | -0.177 46 | -0.266 96 | -2.985 30 | -0.311 99 | -0.331 11 | -0.265 12 | -0.195 62 | |
| c | 0.718 70 | 0.582 67 | 0.575 23 | 0.621 27 | 0.684 46 | 0.587 13 | 0.655 89 | |
| 决定系数R2 | 0.989 48 | 0.953 16 | 0.973 65 | 0.981 19 | 0.981 74 | 0.953 67 | 0.986 27 | |
| 20—40 | a | 0.079 47 | 0.297 73 | 0.214 22 | 0.141 59 | 0.109 95 | 0.094 19 | 0.083 11 |
| b | -0.147 49 | -0.287 56 | -0.308 33 | -0.337 30 | -0.284 99 | -0.257 51 | -0.182 29 | |
| c | 0.640 02 | 0.618 46 | 0.532 96 | 0.601 49 | 0.676 14 | 0.731 44 | 0.738 03 | |
| 决定系数R2 | 0.988 66 | 0.918 24 | 0.972 01 | 0.981 27 | 0.985 23 | 0.994 25 | 0.986 90 | |
表5 指数经验方程拟合水分特征曲线方程参数
Table 5 Exponential empirical equation fitting moisture characteristic curve equation parameters
土层 Soil layer/cm | 参数 Parameter | 处理 Treatment | ||||||
|---|---|---|---|---|---|---|---|---|
| CK | SO | SR | SCM | SM | HSR | SP | ||
| 0—20 | a | 0.075 38 | 0.305 64 | 0.255 10 | 0.228 54 | 0.114 64 | 0.116 40 | 0.108 70 |
| b | -0.177 46 | -0.266 96 | -2.985 30 | -0.311 99 | -0.331 11 | -0.265 12 | -0.195 62 | |
| c | 0.718 70 | 0.582 67 | 0.575 23 | 0.621 27 | 0.684 46 | 0.587 13 | 0.655 89 | |
| 决定系数R2 | 0.989 48 | 0.953 16 | 0.973 65 | 0.981 19 | 0.981 74 | 0.953 67 | 0.986 27 | |
| 20—40 | a | 0.079 47 | 0.297 73 | 0.214 22 | 0.141 59 | 0.109 95 | 0.094 19 | 0.083 11 |
| b | -0.147 49 | -0.287 56 | -0.308 33 | -0.337 30 | -0.284 99 | -0.257 51 | -0.182 29 | |
| c | 0.640 02 | 0.618 46 | 0.532 96 | 0.601 49 | 0.676 14 | 0.731 44 | 0.738 03 | |
| 决定系数R2 | 0.988 66 | 0.918 24 | 0.972 01 | 0.981 27 | 0.985 23 | 0.994 25 | 0.986 90 | |
土层 Soil layer/cm | 压力 Pressure/Pa | 相对误差 Relative error/% | ||||||
|---|---|---|---|---|---|---|---|---|
| CK | SO | SR | SCM | SM | HSR | SP | ||
| 0.0 | 1.27 | 0.02 | 14.05 | 7.35 | 4.07 | 1.14 | 4.85 | |
| 1.0×10⁵ | 2.23 | 0.05 | 5.00 | 3.17 | 7.09 | 4.65 | 2.26 | |
| 0—20 | 3.0×10⁵ | 3.63 | 1.08 | 3.33 | 0.03 | 3.35 | 7.69 | 6.60 |
| 5.0×10⁵ | 7.37 | 0.13 | 6.18 | 6.89 | 6.26 | 13.15 | 6.03 | |
| 1.0×10⁶ | 1.17 | 0.08 | 0.51 | 1.82 | 5.17 | 0.42 | 0.39 | |
| 1.5×10⁶ | 3.50 | 0.65 | 8.31 | 7.50 | 11.52 | 18.39 | 6.00 | |
| 0.0 | 8.22 | 2.94 | 2.67 | 4.09 | 5.03 | 3.71 | 5.99 | |
| 1.0×10⁵ | 3.58 | 9.17 | 3.53 | 6.24 | 6.38 | 3.22 | 2.51 | |
| 20—40 | 3.0×10⁵ | 2.40 | 4.67 | 1.12 | 4.79 | 4.74 | 3.98 | 5.48 |
| 5.0×10⁵ | 7.27 | 7.87 | 10.39 | 7.45 | 3.51 | 2.45 | 6.98 | |
| 1.0×10⁶ | 5.37 | 1.09 | 0.44 | 2.01 | 3.01 | 2.26 | 5.03 | |
| 1.5×10⁶ | 8.74 | 7.57 | 10.60 | 12.22 | 7.09 | 2.04 | 2.73 | |
表6 指数经验方程实测值与拟合值的相对误差
Table 6 Relative errors between measured and fitted values of the exponential empirical equation
土层 Soil layer/cm | 压力 Pressure/Pa | 相对误差 Relative error/% | ||||||
|---|---|---|---|---|---|---|---|---|
| CK | SO | SR | SCM | SM | HSR | SP | ||
| 0.0 | 1.27 | 0.02 | 14.05 | 7.35 | 4.07 | 1.14 | 4.85 | |
| 1.0×10⁵ | 2.23 | 0.05 | 5.00 | 3.17 | 7.09 | 4.65 | 2.26 | |
| 0—20 | 3.0×10⁵ | 3.63 | 1.08 | 3.33 | 0.03 | 3.35 | 7.69 | 6.60 |
| 5.0×10⁵ | 7.37 | 0.13 | 6.18 | 6.89 | 6.26 | 13.15 | 6.03 | |
| 1.0×10⁶ | 1.17 | 0.08 | 0.51 | 1.82 | 5.17 | 0.42 | 0.39 | |
| 1.5×10⁶ | 3.50 | 0.65 | 8.31 | 7.50 | 11.52 | 18.39 | 6.00 | |
| 0.0 | 8.22 | 2.94 | 2.67 | 4.09 | 5.03 | 3.71 | 5.99 | |
| 1.0×10⁵ | 3.58 | 9.17 | 3.53 | 6.24 | 6.38 | 3.22 | 2.51 | |
| 20—40 | 3.0×10⁵ | 2.40 | 4.67 | 1.12 | 4.79 | 4.74 | 3.98 | 5.48 |
| 5.0×10⁵ | 7.27 | 7.87 | 10.39 | 7.45 | 3.51 | 2.45 | 6.98 | |
| 1.0×10⁶ | 5.37 | 1.09 | 0.44 | 2.01 | 3.01 | 2.26 | 5.03 | |
| 1.5×10⁶ | 8.74 | 7.57 | 10.60 | 12.22 | 7.09 | 2.04 | 2.73 | |
模型 Model | 土层 Soil layer/cm | 指标 Index | 处理 Treatment | ||||||
|---|---|---|---|---|---|---|---|---|---|
| CK | SO | SR | SCM | SM | HSR | SP | |||
| 均方根误差RMSE | 0.004 2 | 0.001 8 | 0.004 5 | 0.005 1 | 0.009 5 | 0.006 7 | 0.008 7 | ||
| 0—20 | 绝对平均误差MAE | 0.003 5 | 0.001 1 | 0.003 4 | 0.003 9 | 0.008 1 | 0.006 1 | 0.007 1 | |
| 决定系数R2 | 0.997 0 | 0.997 6 | 0.998 1 | 0.995 6 | 0.990 7 | 0.996 8 | 0.995 6 | ||
| Gardaner | 均方根误差RMSE | 0.007 3 | 0.008 6 | 0.011 3 | 0.004 0 | 0.008 8 | 0.009 6 | 0.011 0 | |
| 20—40 | 绝对平均误差MAE | 0.006 1 | 0.007 7 | 0.008 8 | 0.003 0 | 0.007 4 | 0.007 8 | 0.009 8 | |
| 决定系数R2 | 0.983 3 | 0.993 7 | 0.996 7 | 0.998 2 | 0.981 0 | 0.997 6 | 0.994 8 | ||
| 均方根误差RMSE | 0.007 1 | 0.003 9 | 0.007 0 | 0.005 5 | 0.005 3 | 0.013 4 | 0.017 8 | ||
| 0—20 | 绝对平均误差MAE | 0.004 5 | 0.002 8 | 0.005 6 | 0.004 4 | 0.003 5 | 0.008 1 | 0.014 5 | |
| Rational | 决定系数R2 | 0.993 6 | 0.999 0 | 0.999 8 | 0.997 6 | 0.998 1 | 0.999 9 | 0.973 0 | |
| 均方根误差RMSE | 0.002 3 | 0.004 2 | 0.007 0 | 0.003 0 | 0.009 6 | 0.005 7 | 0.006 9 | ||
| 20—40 | 绝对平均误差MAE | 0.001 7 | 0.003 1 | 0.005 6 | 0.002 1 | 0.009 2 | 0.004 4 | 0.004 9 | |
| 决定系数R2 | 0.995 9 | 0.996 4 | 0.992 5 | 0.999 5 | 0.994 7 | 0.993 0 | 0.978 5 | ||
指数模型 Exponentialmodel | 均方根误差RMSE | 0.004 8 | 0.004 5 | 0.032 7 | 0.030 7 | 0.014 3 | 0.014 5 | 0.008 7 | |
| 0—20 | 绝对平均误差MAE | 0.004 2 | 0.002 8 | 0.022 8 | 0.021 9 | 0.013 1 | 0.013 2 | 0.007 6 | |
| 决定系数R2 | 0.989 5 | 0.953 2 | 0.973 7 | 0.981 2 | 0.981 7 | 0.953 7 | 0.986 3 | ||
| 均方根误差RMSE | 0.009 3 | 0.015 8 | 0.015 8 | 0.046 5 | 0.012 5 | 0.007 5 | 0.008 8 | ||
| 20—40 | 绝对平均误差MAE | 0.007 7 | 0.007 6 | 0.013 0 | 0.013 8 | 0.010 8 | 0.006 3 | 0.007 6 | |
| 决定系数R2 | 0.988 7 | 0.918 2 | 0.972 0 | 0.981 3 | 0.985 2 | 0.994 3 | 0.986 9 | ||
表7 3种模型方程拟合指标
Table 7 3 model equation fitting indicators
模型 Model | 土层 Soil layer/cm | 指标 Index | 处理 Treatment | ||||||
|---|---|---|---|---|---|---|---|---|---|
| CK | SO | SR | SCM | SM | HSR | SP | |||
| 均方根误差RMSE | 0.004 2 | 0.001 8 | 0.004 5 | 0.005 1 | 0.009 5 | 0.006 7 | 0.008 7 | ||
| 0—20 | 绝对平均误差MAE | 0.003 5 | 0.001 1 | 0.003 4 | 0.003 9 | 0.008 1 | 0.006 1 | 0.007 1 | |
| 决定系数R2 | 0.997 0 | 0.997 6 | 0.998 1 | 0.995 6 | 0.990 7 | 0.996 8 | 0.995 6 | ||
| Gardaner | 均方根误差RMSE | 0.007 3 | 0.008 6 | 0.011 3 | 0.004 0 | 0.008 8 | 0.009 6 | 0.011 0 | |
| 20—40 | 绝对平均误差MAE | 0.006 1 | 0.007 7 | 0.008 8 | 0.003 0 | 0.007 4 | 0.007 8 | 0.009 8 | |
| 决定系数R2 | 0.983 3 | 0.993 7 | 0.996 7 | 0.998 2 | 0.981 0 | 0.997 6 | 0.994 8 | ||
| 均方根误差RMSE | 0.007 1 | 0.003 9 | 0.007 0 | 0.005 5 | 0.005 3 | 0.013 4 | 0.017 8 | ||
| 0—20 | 绝对平均误差MAE | 0.004 5 | 0.002 8 | 0.005 6 | 0.004 4 | 0.003 5 | 0.008 1 | 0.014 5 | |
| Rational | 决定系数R2 | 0.993 6 | 0.999 0 | 0.999 8 | 0.997 6 | 0.998 1 | 0.999 9 | 0.973 0 | |
| 均方根误差RMSE | 0.002 3 | 0.004 2 | 0.007 0 | 0.003 0 | 0.009 6 | 0.005 7 | 0.006 9 | ||
| 20—40 | 绝对平均误差MAE | 0.001 7 | 0.003 1 | 0.005 6 | 0.002 1 | 0.009 2 | 0.004 4 | 0.004 9 | |
| 决定系数R2 | 0.995 9 | 0.996 4 | 0.992 5 | 0.999 5 | 0.994 7 | 0.993 0 | 0.978 5 | ||
指数模型 Exponentialmodel | 均方根误差RMSE | 0.004 8 | 0.004 5 | 0.032 7 | 0.030 7 | 0.014 3 | 0.014 5 | 0.008 7 | |
| 0—20 | 绝对平均误差MAE | 0.004 2 | 0.002 8 | 0.022 8 | 0.021 9 | 0.013 1 | 0.013 2 | 0.007 6 | |
| 决定系数R2 | 0.989 5 | 0.953 2 | 0.973 7 | 0.981 2 | 0.981 7 | 0.953 7 | 0.986 3 | ||
| 均方根误差RMSE | 0.009 3 | 0.015 8 | 0.015 8 | 0.046 5 | 0.012 5 | 0.007 5 | 0.008 8 | ||
| 20—40 | 绝对平均误差MAE | 0.007 7 | 0.007 6 | 0.013 0 | 0.013 8 | 0.010 8 | 0.006 3 | 0.007 6 | |
| 决定系数R2 | 0.988 7 | 0.918 2 | 0.972 0 | 0.981 3 | 0.985 2 | 0.994 3 | 0.986 9 | ||
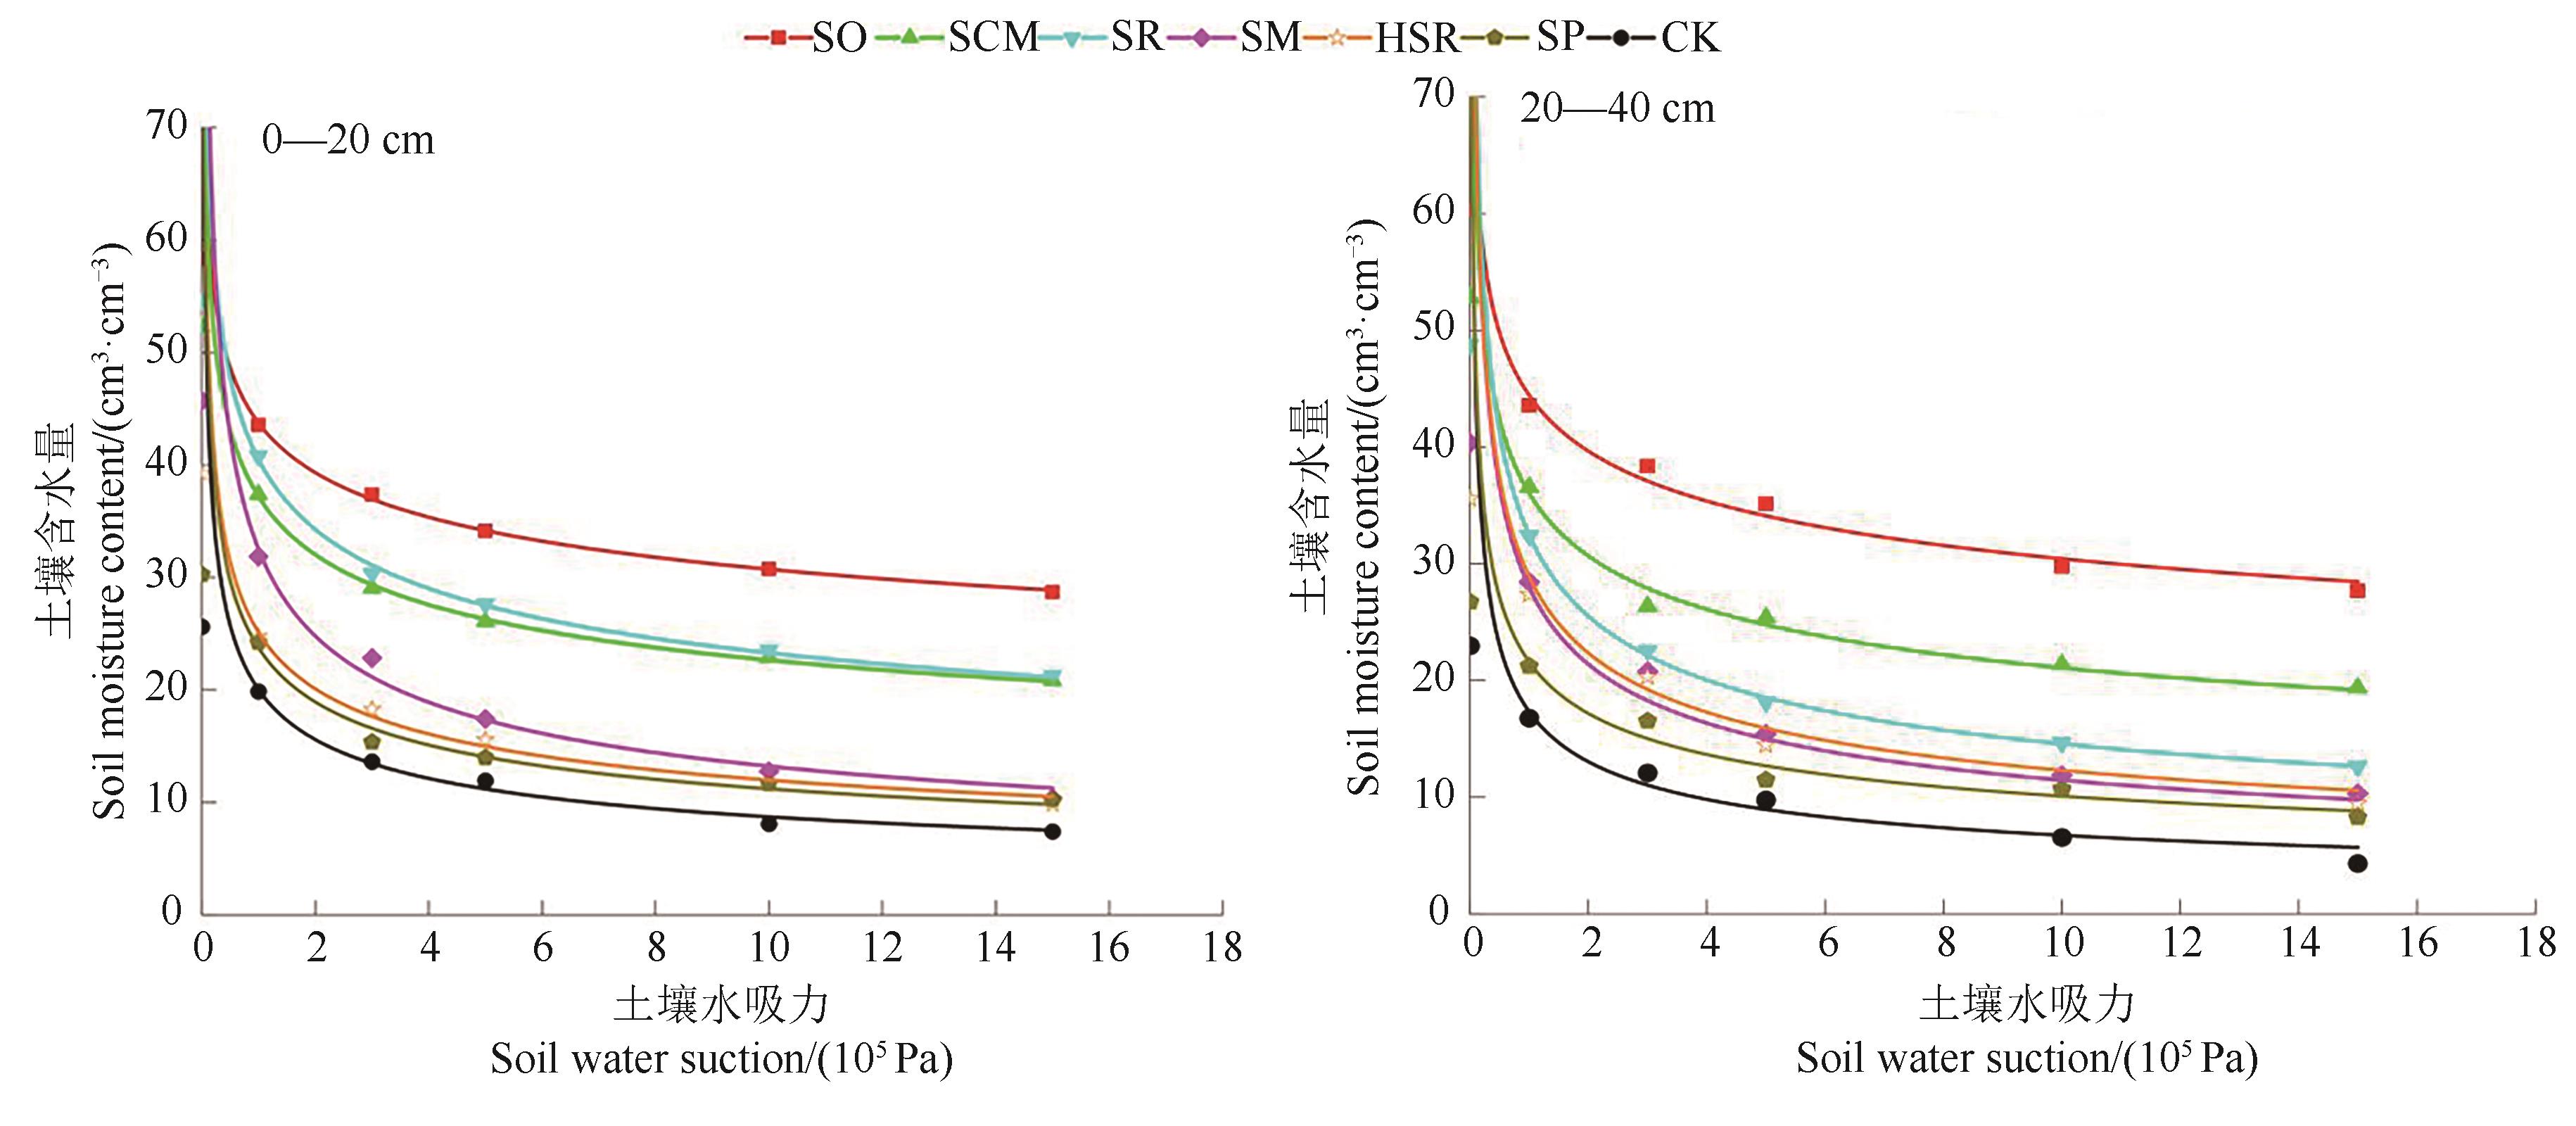
图1 各处理下的土壤水分特征曲线
Fig. 1 Soil moisture characteristic curves under different treatments
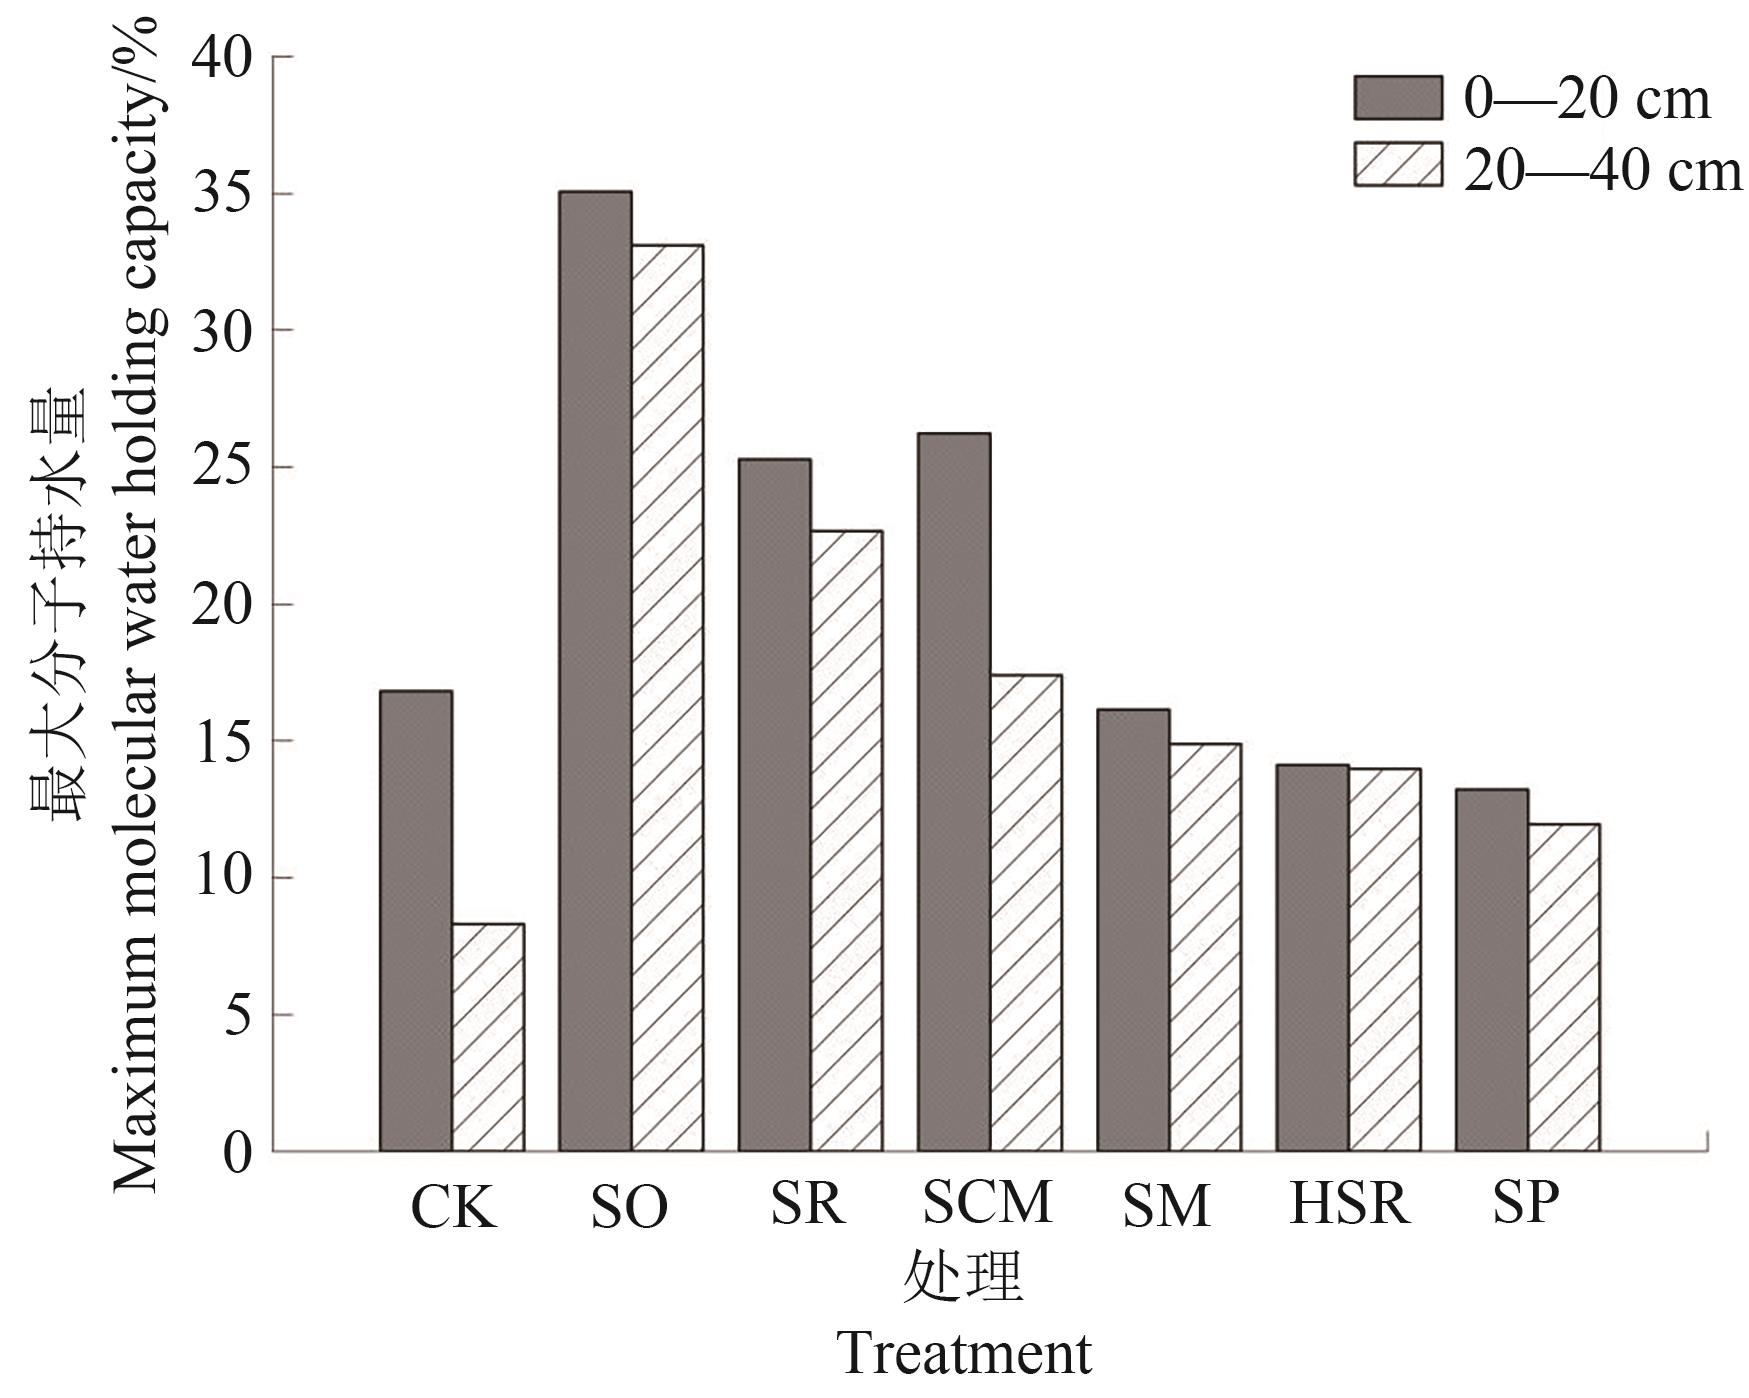
图2 各处理下土壤最大分子持水量
Fig. 2 Soil maximum molecular water holding capacity under different treatments
| 1 | 钟紫.土壤水分含量测定实验[J].农村经济与科技,2016,27(4):2-3. |
| 2 | 王林峰,张平宇,李鹤,等.东北西部农牧交错带社会生态系统脆弱性[J].中国科学院大学学报,2018,35(3):345-352. |
| WANG L F, ZHANG P Y, LI H, et al.. Vulnerability of social-ecosystem in agro-pastoral ecotone in western Northeast China [J]. J. Univ. Chin. Acad. Sci., 2018,35(3):345-352. | |
| 3 | 于险峰,张仁军.发挥好东北西部干旱半干旱地区粮食增产潜力[N].农民日报,2023-03-08(005). |
| 4 | 孙姝.浅析辽宁旱灾时空分布格局和旱灾应对措施[J].中国减灾,2013(6):45-47. |
| 5 | MARQUINA S, PÉREZ T, DONOSO L, et al.. NO,N2O and CO2 soil emissions from Venezuelan corn fields under tillage and no-tillage agriculture [J]. Nutr. Cycl. Agroecosyst., 2015,101(1):123-137. |
| 6 | 王晓波,苗壮.论齐齐哈尔市的水资源优化配置与农业可持续发展[J].水利科学与寒区工程,2021,4(4):184-188. |
| 7 | 赵亚丽,郭海斌,薛志伟,等.耕作方式与秸秆还田对土壤微生物数量、酶活性及作物产量的影响[J].应用生态学报,2015,26(6):1785-1792. |
| ZHAO Y L, GUO H B, XUE Z W, et al.. Effects of tillage and straw returning on microorganism quantity,enzyme activities in soils and grain yield [J]. Chin. J. Appl. Ecol., 2015,26(6):1785-1792. | |
| 8 | 王立春.吉林玉米高产理论与实践[M].北京:科学出版社,2014:246-247. |
| 9 | 李亚贞,肖国滨,肖小军,等.培肥和耕作措施季节性干旱下对红壤剖面水分变化和产量的影响[J].水土保持研究,2014,21(6):78-83. |
| LI Y Z, XIAO G B, XIAO X J, et al..Effects of fertilization and tillage patterns on the dynamic of soil profile moisture content and corn yield in red soil under seasonal drought conditions [J]. Res. Soil Water Conserv., 2014,21(6):78-83. | |
| 10 | 黄尚书,钟义军,何绍浪,等.耕作深度对红壤坡耕地季节性干旱期土壤水分变化特征的影响[J].土壤通报,2023,54(1):39-45. |
| HUANG S S, ZHONG Y J, HE S L, et al.. Effects of tillage depth on characteristics of soil moisture in red soil sloping farmland under seasonal drought [J]. Chin. J. Soil Sci., 2023,54(1):39-45. | |
| 11 | 郑欣荣,王利书,齐鸣,等.秸秆还田下灌水量对土壤水分运移特性研究[J].节水灌溉,2018(11):20-23, 28. |
| ZHENG X R, WANG L S, QI M, et al.. Effects of irrigation amount on the characteristics of soil water migration under straw returning [J]. Water Sav. Irrig., 2018(11):20-23, 28. | |
| 12 | 李萍.耕作措施与干旱水平对红壤玉米根-土水分关系的影响[D]. 武汉:华中农业大学,2017. |
| LI P. Effect of tillage and drought on water relations of maize root in a red soil [D]. WuHan:Huazhong Agricultural University, 2017. | |
| 13 | 吴鹏年,王艳丽,侯贤清,等.秸秆还田配施氮肥对宁夏扬黄灌区滴灌玉米产量及土壤物理性状的影响[J].土壤,2020,52(3):470-475. |
| WU P N, WANG Y L, HOU X Q, et al.. Effects of straw returning with nitrogen fertilizer on maize yield and soil physical properties under drip-irrigation in Yanghuang irrigation area in Ningxia [J]. Soils, 2020,52(3):470-475. | |
| 14 | 张丽华,徐晨,于江,等.半湿润区秸秆还田对土壤水分、温度及玉米产量的影响[J].水土保持学报,2021,35(4):299-306. |
| ZHANG L H, XU C, YU J, et al.. Effects of straw returning on soil moisture, temperature and maize yield in semiHumid area [J]. J. Soil Water Conserv., 2021,35(4):299-306. | |
| 15 | 周卓丽,张卓栋,高晓飞,等.离心机与压力板仪测定土壤水分特征曲线比较[J].中国水土保持科学,2022,20(4):101-108. |
| ZHOU Z L, ZHANG Z D, GAO X F, et al.. Comparison of centrifuge and pressure plate on soil water retention curve determination [J]. Sci. Soil Water Conserv., 2022,20(4):101-108. | |
| 16 | GARG A, XING X G, BORDOLOI S. Water retention models for soils mixed with waste residues:application of the modified van-Genuchten and Brooks-Corey models [J].Biomass Convers.Biorefin., 2022,12(11):5059-5066. |
| 17 | NI H Y, LIU J F, JIVKOV A P, et al.. A dual-porosity model for analysis of temperature effects on hydro-mechanical behaviour of GMZ bentonite under unconfined conditions [J/OL]. Comput. Geotech., 2023,154:105127 [2023-08-18].. |
| 18 | 辛琳,郝新生,崔清亮.土壤水分特征曲线的4种经验公式拟合研究[J].山西农业科学,2018,46(2):256-259. |
| XIN L, HAO X S, CUI Q L. Study on the fitting of 4 empirical formulas of soil water characteristic curve [J]. J. Shanxi Agric. Sci., 2018,46(2):256-259. | |
| 19 | XING X G, MA X Y. Simplification of the Gardner model: effects on maximum upward flux in the presence of a shallow water table [J]. Hydrogeol. J., 2018,26(4):1117-1122. |
| 20 | ALEXANDER J, POLLACCO P, JOSÉ M, et al.. Reduction of feasible parameter space of the inverted soil hydraulic parameter sets for Kosugi model [J]. Soil Sci., 2013,178(6): 49-52 |
| 21 | SU L J, WANG J, QIN X Q, et al.. Approximate solution of a one-dimensional soil water infiltration equation based on the Brooks-Corey model [J]. Geoderma, 2017, 297: 28-37. |
| 22 | 李源,宋维峰,马建刚.中国西南水梯田土壤水分特性研究:以哈尼梯田为例[J].水土保持学报,2021,35(2):160-169. |
| LI Y, SONG W F, MA J G. Soil moisture characteristics of water terrace in southwest China—a case study of Hani terraces [J]. J.Soil Water Conserv., 2021,35(2):160-169. | |
| 23 | 秦文静,樊贵盛.冲洪积平原土壤低吸力阶段水分特征曲线影响因素研究[J].节水灌溉,2019(10):38-42. |
| QIN W J, FAN G S. Study on influencing factors of water characteristic curve of alluvial-diluvial plain soil at low suction stage [J]. Water Sav. Irrig., 2019(10):38-42. | |
| 24 | 秦文静,樊贵盛.原状黄土土壤水分特征曲线预测模型优选[J].节水灌溉,2020(3):17-20. |
| QIN W J, FAN G S. Comparison and selection of prediction models for soil water characteristic curves of undisturbed loess [J]. Water Sav. Irrig., 2020(3):17-20. | |
| 25 | 毛妍婷,崔荣阳,陈安强,等.垄作方向对不同坡位红壤坡耕地耕层土壤水分特征曲线的影响[J].土壤通报,2022,53(2):308-314. |
| MAO Y T, CUI R Y, CHEN A Q, et al.. Effects of ridge directions on water characteristic curves of cultivated top-layer soils in different slope positions [J]. Chin. J. Soil Sci., 2022,53(2):308-314. | |
| 26 | 杨茂进,张越,施梦璐,等.崩岗土壤水分特征曲线与非饱和渗透系数分析[J].森林与环境学报,2023,43(4):433-441. |
| YANG M J, ZHANG Y, SHI M L, et al.. Analysis of soil moisture characteristic curves and unsaturated permeability coefficients of Benggang soil [J]. J. For. Environ., 2023,43(4):433-441. | |
| 27 | 郭同铠,毛伟兵,孙玉霞,等.颗粒级配变化对黄三角盐碱土水分特征曲线参数的影响——以VG模型和Gardner模型为例[J].节水灌溉,2020(1):29-33. |
| GUO T K, MAO W B, SUN Y X, et al.. Effect of particle gradation on water characteristic curve parameters of yellow triangle saline alkali soil:a case study of VG model and Gardner model [J]. Water Sav. Irrig., 2020(1):29-33. | |
| 28 | 林晓燕,王晶晶,吴炳孙,等.施肥对热带砖红壤胶林土壤水分特征曲线的影响及模型优选[J].水土保持研究,2024,31(1):105-116. |
| LIN X Y, WANG J J, WU B S, et al.. Soil water characteristics curves and model optimization of tropical latosol rubber planting area under different fertilization [J]. Res. Soil Water Conserv., 2024,31(1):105-116. | |
| 29 | 王晓晗,肖鹏安,宋达,等.自主PDM数据建模方法及CAD集成[J].机械工程师,2024 (3):85-90. |
| WANG X H, XIAO P A, SONG D,et al.. Autonomous PDM data modeling method and CAD integration [J]. Mechan. Eng., 2024 (3): 85-90. | |
| 30 | 赵琴琴,李翔,冯频频,等.基于OPLS-DA算法的Ⅱ类切口围术期抗菌药物规范化治疗管理模式[J].中国临床药学杂志,2022,31(12):887-892. |
| ZHAO Q Q, LI X, FENG P P, et al.. A standardized treatment management mode of perioperative antibacterial drugs for class Ⅱ incision based on OPLS-DA algorithm [J]. Chin. J. Clin.Pharm., 2022,31(12):887-892. | |
| 31 | 向小华,宋琪峰,陈喜,等.融合地形和土壤特征的流域蓄水容量模型[J].水科学进展,2013,24(5):651-657. |
| XIANG X H, SONG Q F, CHEN X, et al.. A storage capacity model integrating terrain and soil characteristics [J]. Adv. Water Sci., 2013,24(5):651-657. | |
| 32 | 张红卫,陈怀亮,刘忠阳.基于MODIS数据的增强型土壤表层水分含量指数模型构造与应用[J].气象科技,2012,40(6):1039-1043. |
| ZHANG H W, CHEN H L, LIU Z Y.Construction and application of enhanced surface water content index based on MODIS data [J]. Meteor. Sci. Technol., 2012,40(6):1039-1043. | |
| 33 | 战秀梅,宋涛,冯小杰,等.耕作及秸秆还田对辽南地区土壤水分及春玉米水分利用效率的影响[J].沈阳农业大学学报,2017,48(6): 666-672. |
| ZHAN X M, SONG T, FENG X J, et al.. Effect of tillage and straw application on soil water and water use efficiency of spring maize in southern area of Liaoning province [J]. J. Shenyang Agric. Univ., 2017,48(6):666-672. | |
| 34 | 李玉梅,王晓轶,王根林,等.不同耕法及秸秆还田对土壤水分运移变化的影响[J].水土保持通报,2019,39(5):40-45, 53. |
| LI Y M, WANG X Y, WANG G L, et al.. Effects of straw returning method partnered with different tillage methods on migration of soil water [J]. Bull. Soil Water Conserv., 2019,39(5):40-45, 53. | |
| 35 | 殷文,柴强,胡发龙,等.干旱内陆灌区不同秸秆还田方式下春小麦田土壤水分利用特征[J].中国农业科学,2019,52(7):1247-1259. |
| YIN W, CHAI Q, HU F L, et al.. Characteristics of soil water utilization in spring wheat field with different straw retention approaches in dry inland irrigation areas [J]. Sci. Agric. Sin., 2019,52(7):1247-1259. |
| [1] | 赵炳地, 张久明, 朱莹雪, 匡恩俊, 袁佳慧, 迟凤琴, 孙磊, 李宁. 不同秸秆还田量对土壤团聚体及有机碳含量的影响[J]. 中国农业科技导报, 2025, 27(1): 193-200. |
| [2] | 熊橙梁, 张庆富, 姚未远, 夏滔, 许庆平, 周喜新, 张毅, 陈丽鹃, 杨柳. 添加不同类型水稻秸秆对植烟连作土壤微生物群落的影响[J]. 中国农业科技导报, 2025, 27(1): 233-240. |
| [3] | 董林林, 查金芳, 沈明星, 王海候, 施林林, 陶玥玥, 周新伟, 陆长婴. 长期秸秆还田对稻麦轮作区土壤有机碳组分构成的影响[J]. 中国农业科技导报, 2022, 24(3): 166-175. |
| [4] | 刘晓辉, 高晓梅, 于淼, 李杨, 敖静, 孙玉禄, 王智学. 秸秆还田量对东北旱地土壤磷素淋溶及玉米产量的影响[J]. 中国农业科技导报, 2022, 24(10): 154-160. |
| [5] | 李双, 张伟, 王丽, 李孝军, 崔俊涛. 秸秆还田对不同地力黑土培肥与茎腐病害发生的影响[J]. 中国农业科技导报, 2021, 23(8): 80-90. |
| [6] | 高日平, §, 刘小月, §, 杜二小, 韩云飞, 任永峰, 高宇, 赵沛义, 李焕春, 张鹏, . 垄膜沟播与秸秆还田对内蒙古黄土高原玉米农田土壤水分、酶活性及产量的影响[J]. 中国农业科技导报, 2021, 23(11): 181-190. |
| [7] | 牛桂言1,邵惠芳1*,朱金峰2,黄五星1,许自成1,郭利3. 我国植烟土壤修复的研究进展[J]. 中国农业科技导报, 2017, 19(3): 115-122. |
| [8] | 邹国元[1] 张福锁[2] 等. 秸秆还田对旱地土壤反硝化的影响[J]. , 2001, 3(6): 47-50. |
| 阅读次数 | ||||||
|
全文 |
|
|||||
|
摘要 |
|
|||||
 京公网安备11010802021197号