


中国农业科技导报 ›› 2025, Vol. 27 ›› Issue (6): 16-27.DOI: 10.13304/j.nykjdb.2024.0086
王伟明1( ), 潘欣1, 孔德平2, 安宇1, 郭爽1, 孙志梅1, 薛澄1, 孙荣军3, 马文奇1(), 许华森1()
收稿日期:2024-02-01
接受日期:2024-04-22
出版日期:2025-06-15
发布日期:2025-06-23
通讯作者:
马文奇,许华森
作者简介:王伟明 E-mail:wangweiming2022@126.com
基金资助:
Weiming WANG1(), Xin PAN1, Deping KONG2, Yu AN1, Shuang GUO1, Zhimei SUN1, Cheng XUE1, Rongjun SUN3, Wenqi MA1(), Huasen XU1()
Received:2024-02-01
Accepted:2024-04-22
Online:2025-06-15
Published:2025-06-23
Contact:
Wenqi MA,Huasen XU
摘要:
集约化生产造成农作物种植渐趋简单化,目前对我国作物多样化时空变异定量及其影响因素的研究比较缺乏。基于我国1949—2021年作物生产、耕地利用、社会经济和生产技术数据,利用时间序列变异位点检测和随机森林模型定量分析全国作物多样性的时空变化特征及其驱动因素。结果表明,在时间上,全国作物和粮食作物的多样化指数表现出多次明显历史变动,其中1991—2005年是历史最高时期。在空间上,作物和粮食作物的多样化指数均以四川盆地及周边地区为全国最高,华南区最低。在全国尺度上,农村居民人均可支配收入对作物和粮食作物多样化指数变化的贡献率最大,分别为21.0%和27.5%。在区域尺度上,在东北平原区,禾本科作物规模、豆科作物规模和农村居民人均可支配收入是影响作物和粮食作物多样化指数最高的因素;在北方干旱半干旱区和黄淮海平原区,禾本科作物规模和农村居民人均可支配收入是影响作物和粮食作物多样化指数最高的因素;在其他6个农业区,作物和粮食作物多样化指数明显受社会经济因素的影响。因此,在我国作物种植结构调整中,应根据农村经济的实际,进一步明确农业区作物生产功能定位、优化禾本科和豆科作物种植面积,以夯实粮食安全根基、推动农业绿色发展和提高农业应对气候变化能力。
中图分类号:
王伟明, 潘欣, 孔德平, 安宇, 郭爽, 孙志梅, 薛澄, 孙荣军, 马文奇, 许华森. 我国作物多性化时空变化特征及影响因素[J]. 中国农业科技导报, 2025, 27(6): 16-27.
Weiming WANG, Xin PAN, Deping KONG, Yu AN, Shuang GUO, Zhimei SUN, Cheng XUE, Rongjun SUN, Wenqi MA, Huasen XU. Spatiotemporal Characteristics and Their Influencing Factors of Crop Diversification in China[J]. Journal of Agricultural Science and Technology, 2025, 27(6): 16-27.
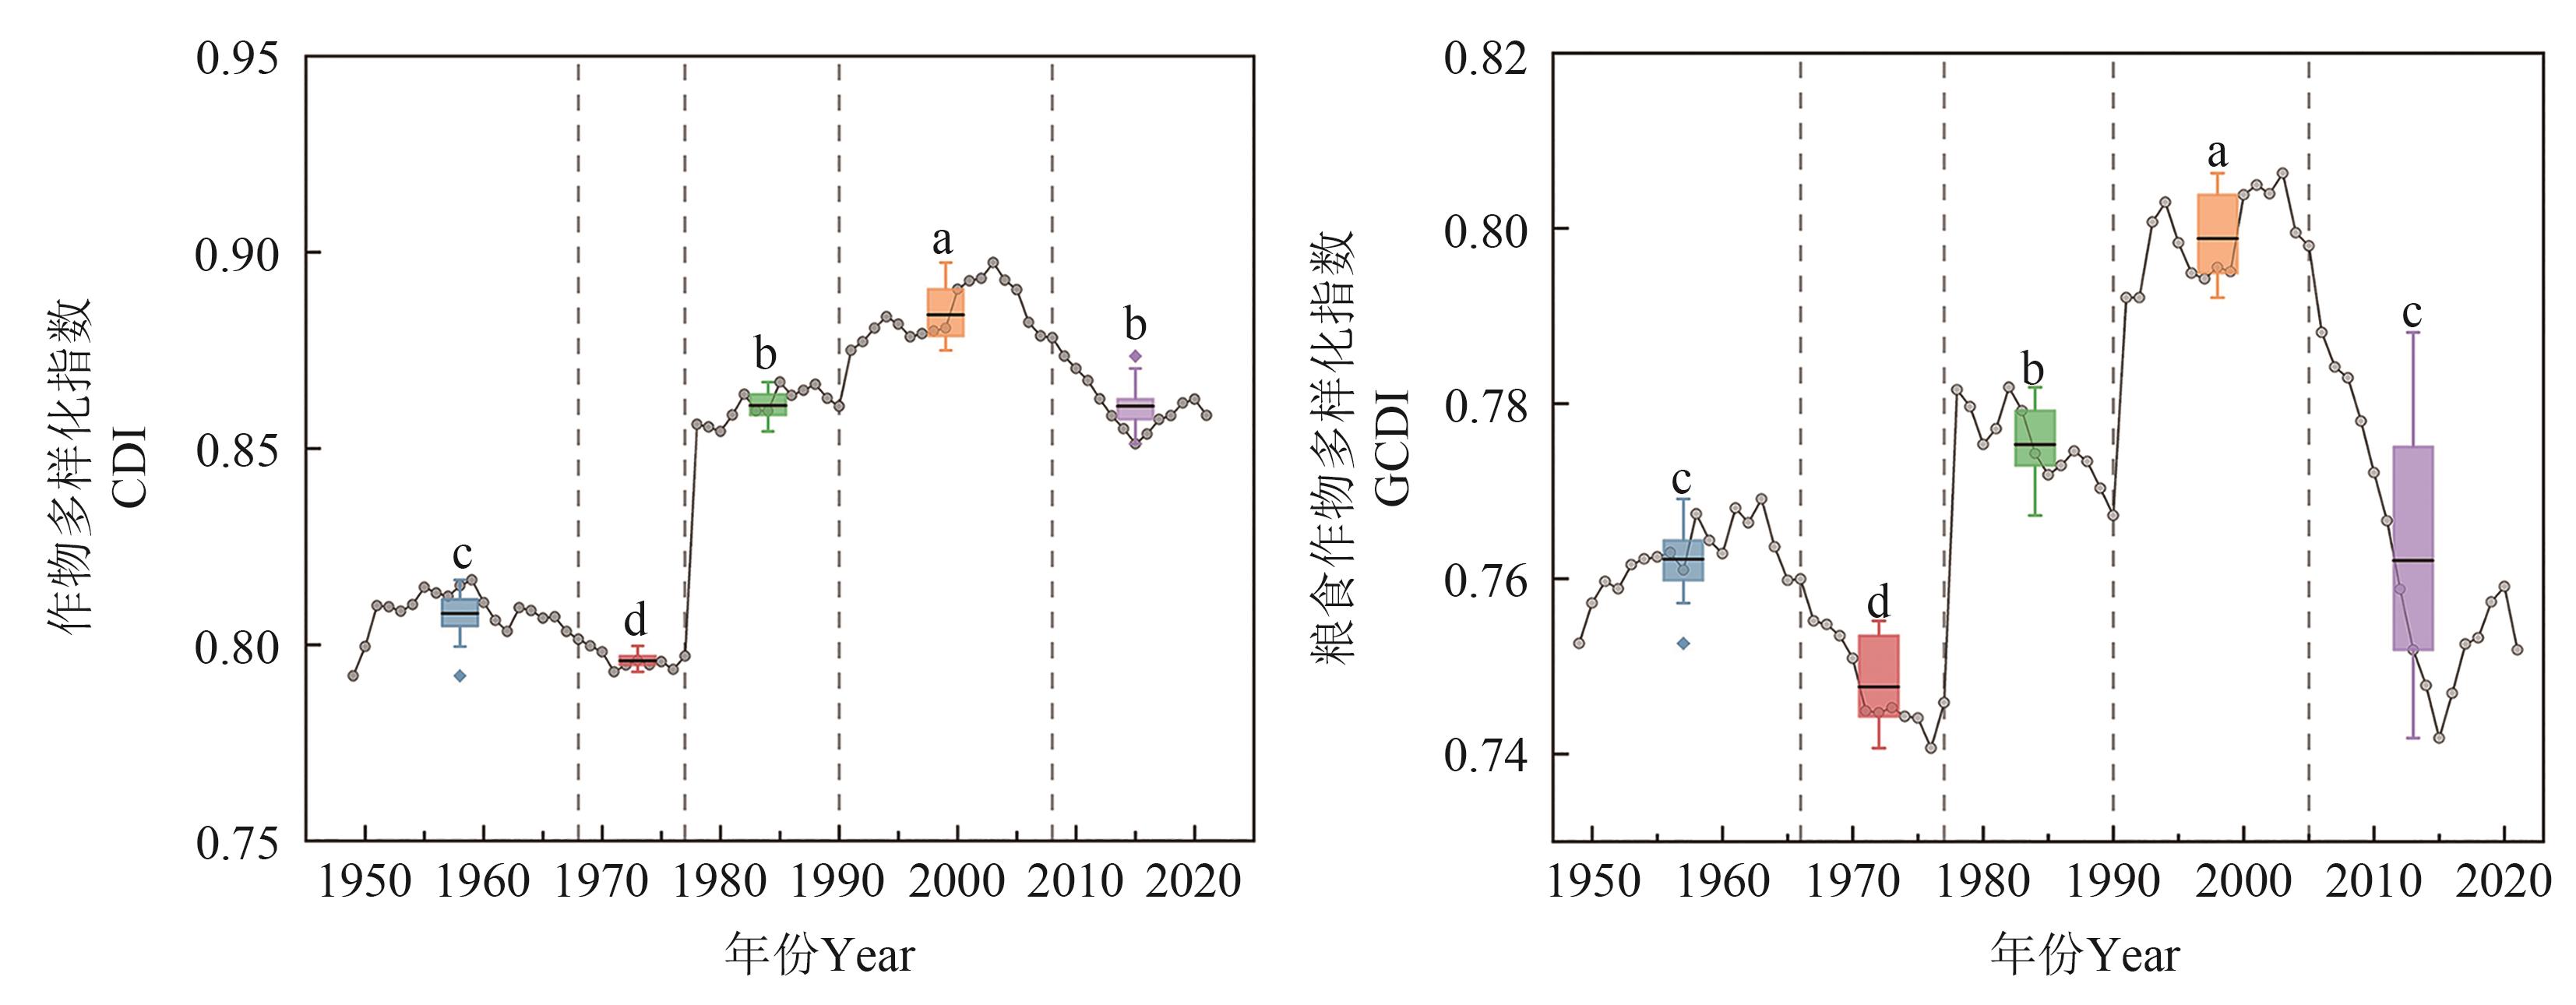
图1 1949—2021年全国作物多样化指数和粮食作物多样化指数注:竖直虚线表示该年为时间序列变点;不同颜色的箱体表示该时间序列变化区间的作物多样化指数,箱体中的实线表示平均值;不同小写字母表示不同时间序列变化区间在P<0.05水平差异显著。
Fig. 1 CDI and GCDI in China from 1949 to 2021Note:The vertical dashed line indicates that this year is a changepoint in the time series; the different colored boxes represent the crops diversity index of the time series variation interval, the solid line in the boxes represent mean values; different lowercase letters indicate significant differences between different time series change interval at P<0.05 level.
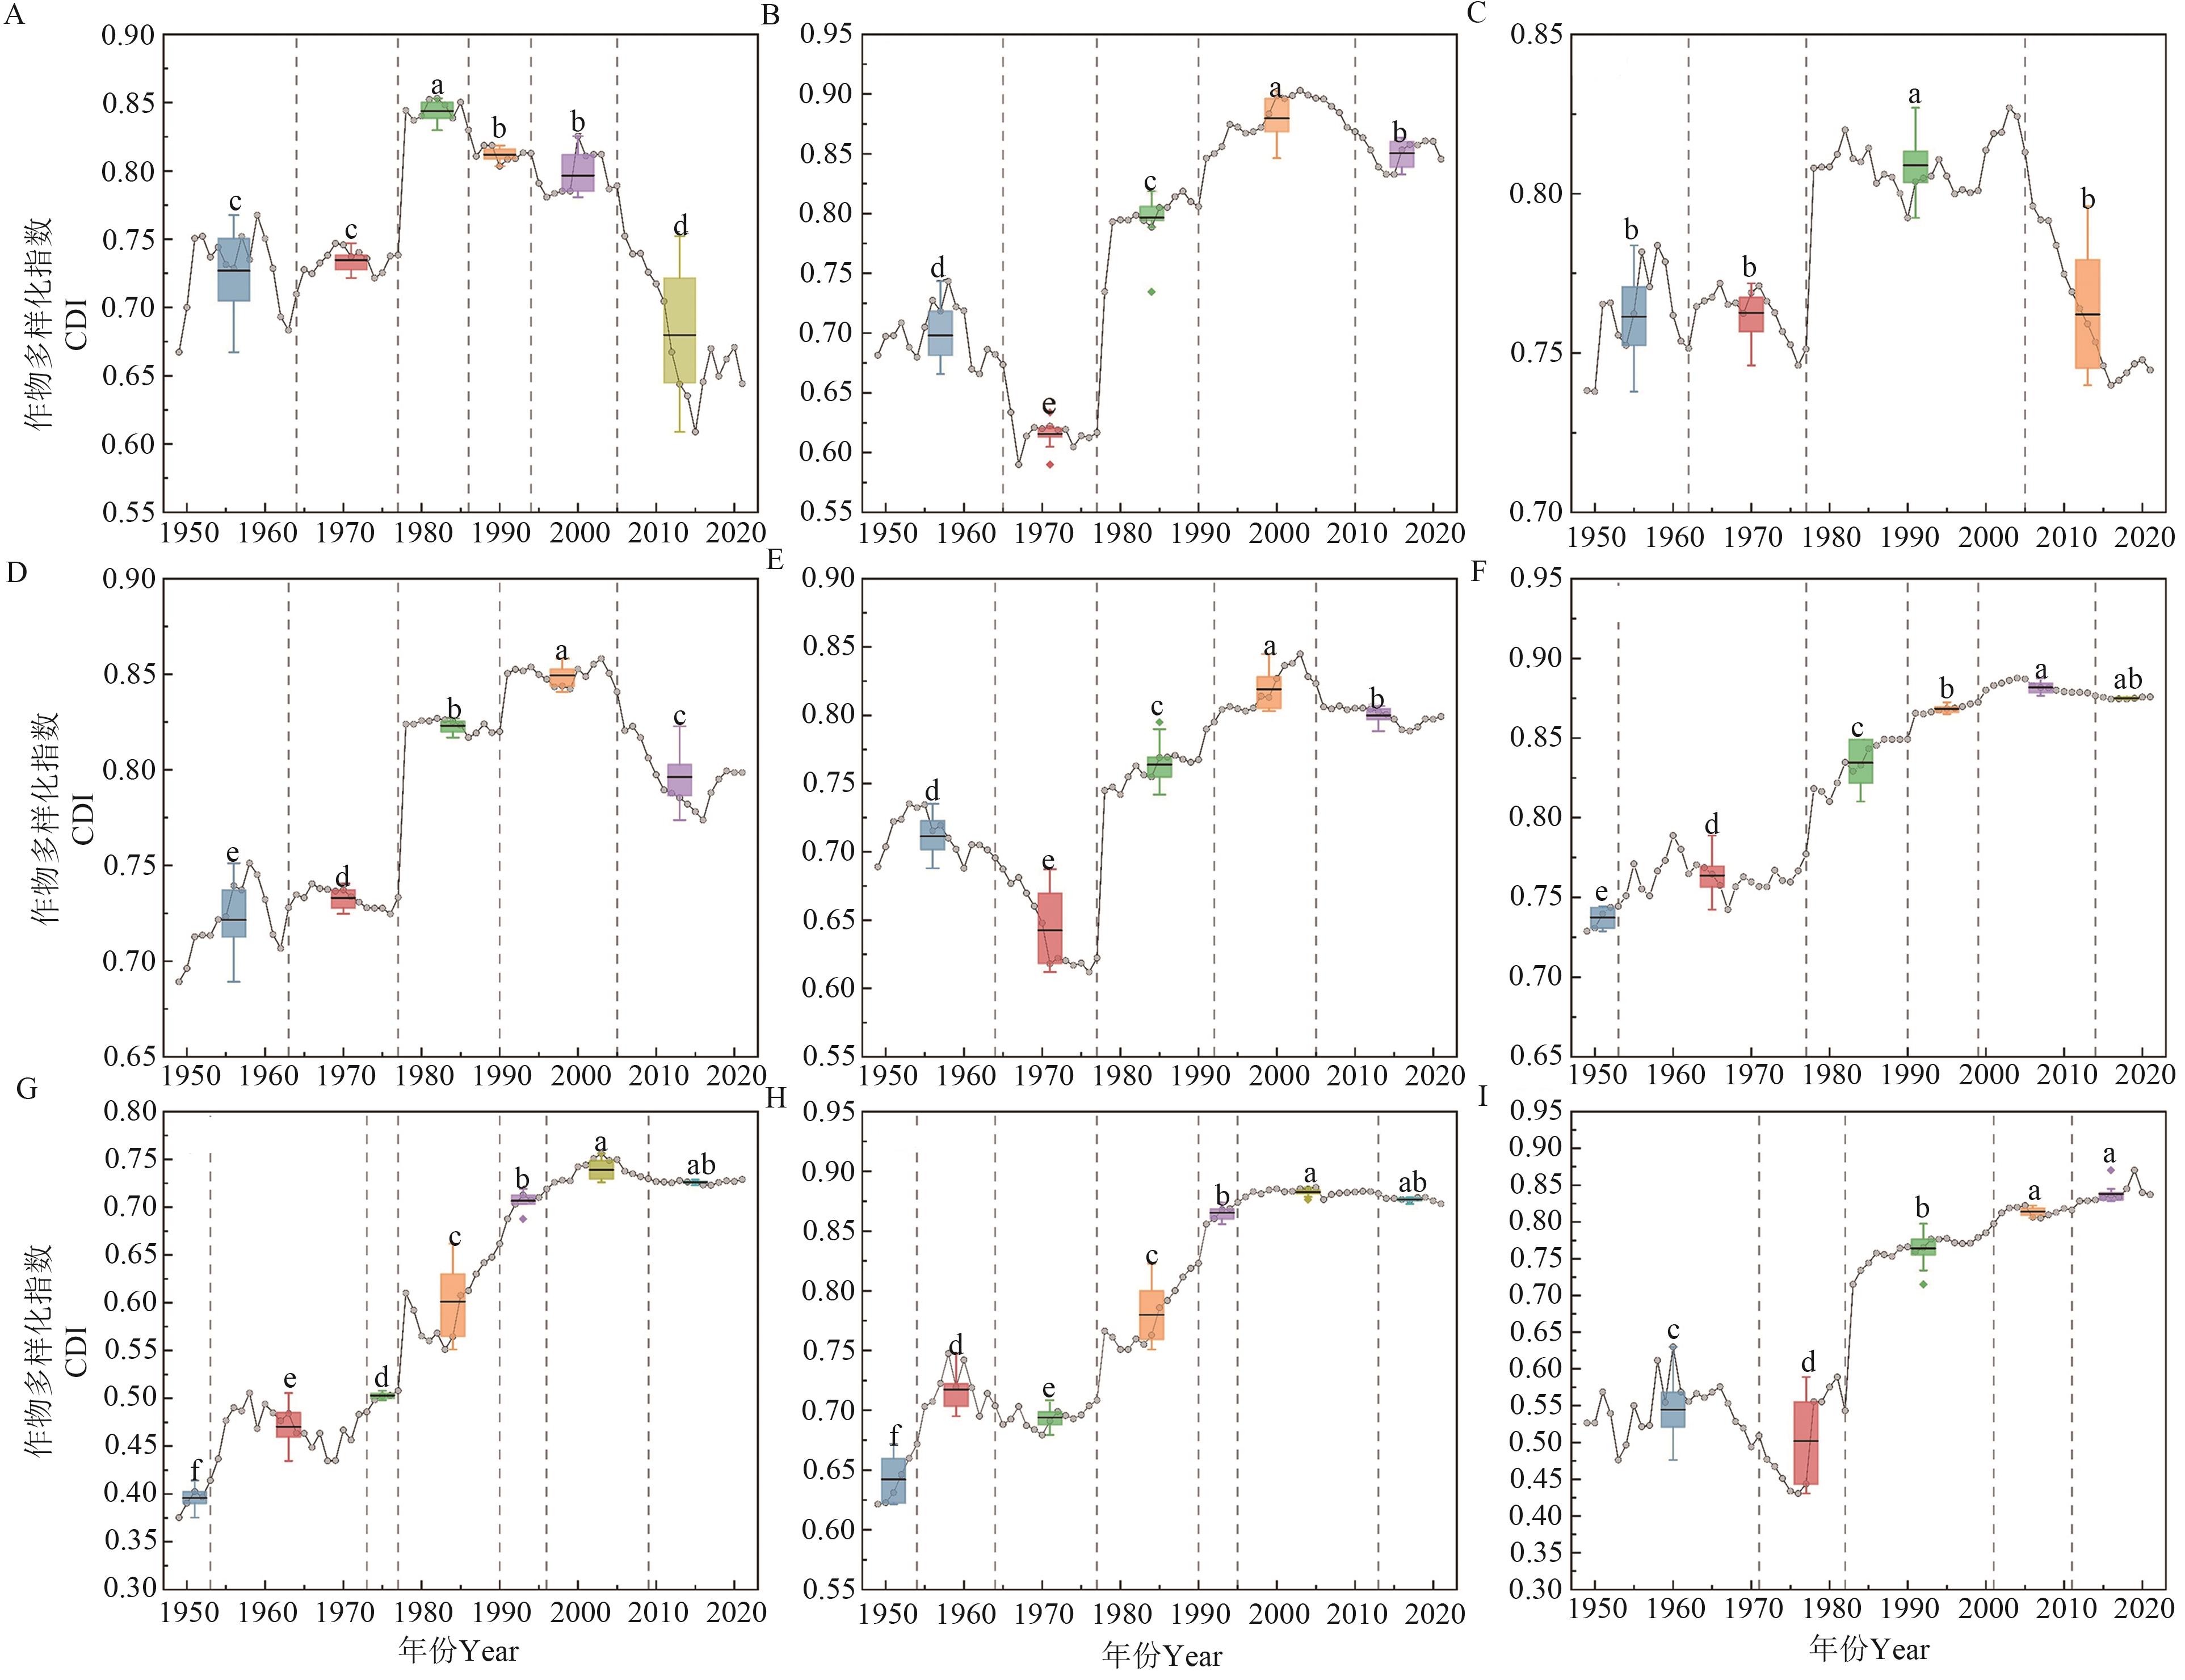
图2 1949—2021年不同农业区作物多样化指数A:东北平原区;B:北方干旱半干旱区;C:黄淮海平原区;D:黄土高原区;E:长江中下游地区;F:四川盆地及周边地区;G:华南区;H:云贵高原区;I:青藏高原区。竖直虚线表示该年为时间序列变点;不同颜色的箱体表示该时间序列变化区间的作物多样化指数,箱体中的实线表示平均值;不同小写字母表示不同时间序列变化区间在P<0.05水平差异显著
Fig. 2 CDI in different agricultural regions from 1949 to 2021A: Northeast China Plain Region; B: Arid and Semi-arid Northern China Region; C: Huang-Huai-Hai Plain Region; D: Loess Plateau Region; E: Middle and Lower Reaches of the Yangtze River Region; F: Sichuan Basin and Its Surrounding Areas; G: South China Region; H: Yunnan-Guizhou Plateau Region; I: Tibetan Plateau Region. The vertical dashed line indicates that this year is a changepoint in the time series; the different colored boxes represent the crops diversity index of the time series variation interval, the solid line in the boxes represent mean values; different lowercase letters indicate significant differences between different time series change interval at P<0.05 level

图3 1949—2021年不同农业区粮食作物多样化指数A:东北平原区;B:北方干旱半干旱区;C:黄淮海平原区;D:黄土高原区;E:长江中下游地区;F:四川盆地及周边地区;G:华南区;H:云贵高原区;I:青藏高原区。竖直虚线表示该年为时间序列变点;不同颜色的箱体表示该时间序列变化区间的作物多样化指数,箱体中的实线表示平均值;不同小写字母表示不同时间序列变化区间在P<0.05水平差异显著
Fig. 3 GCDI in different agricultural regions from 1949 to 2021A: Northeast China Plain Region; B: Arid and Semi-arid Northern China Region; C: Huang-Huai-Hai Plain Region; D: Loess Plateau Region; E: Middle and Lower Reaches of the Yangtze River Region; F: Sichuan Basin and Its Surrounding Areas; G: South China Region; H: Yunnan-Guizhou Plateau Region; I: Tibetan Plateau Region. The vertical dashed line indicates that this year is a changepoint in the time series; the different colored boxes represent the crops diversity index of the time series variation interval, the solid line in the boxes represent mean values; different lowercase letters indicate significant differences between different time series change interval at P<0.05 level
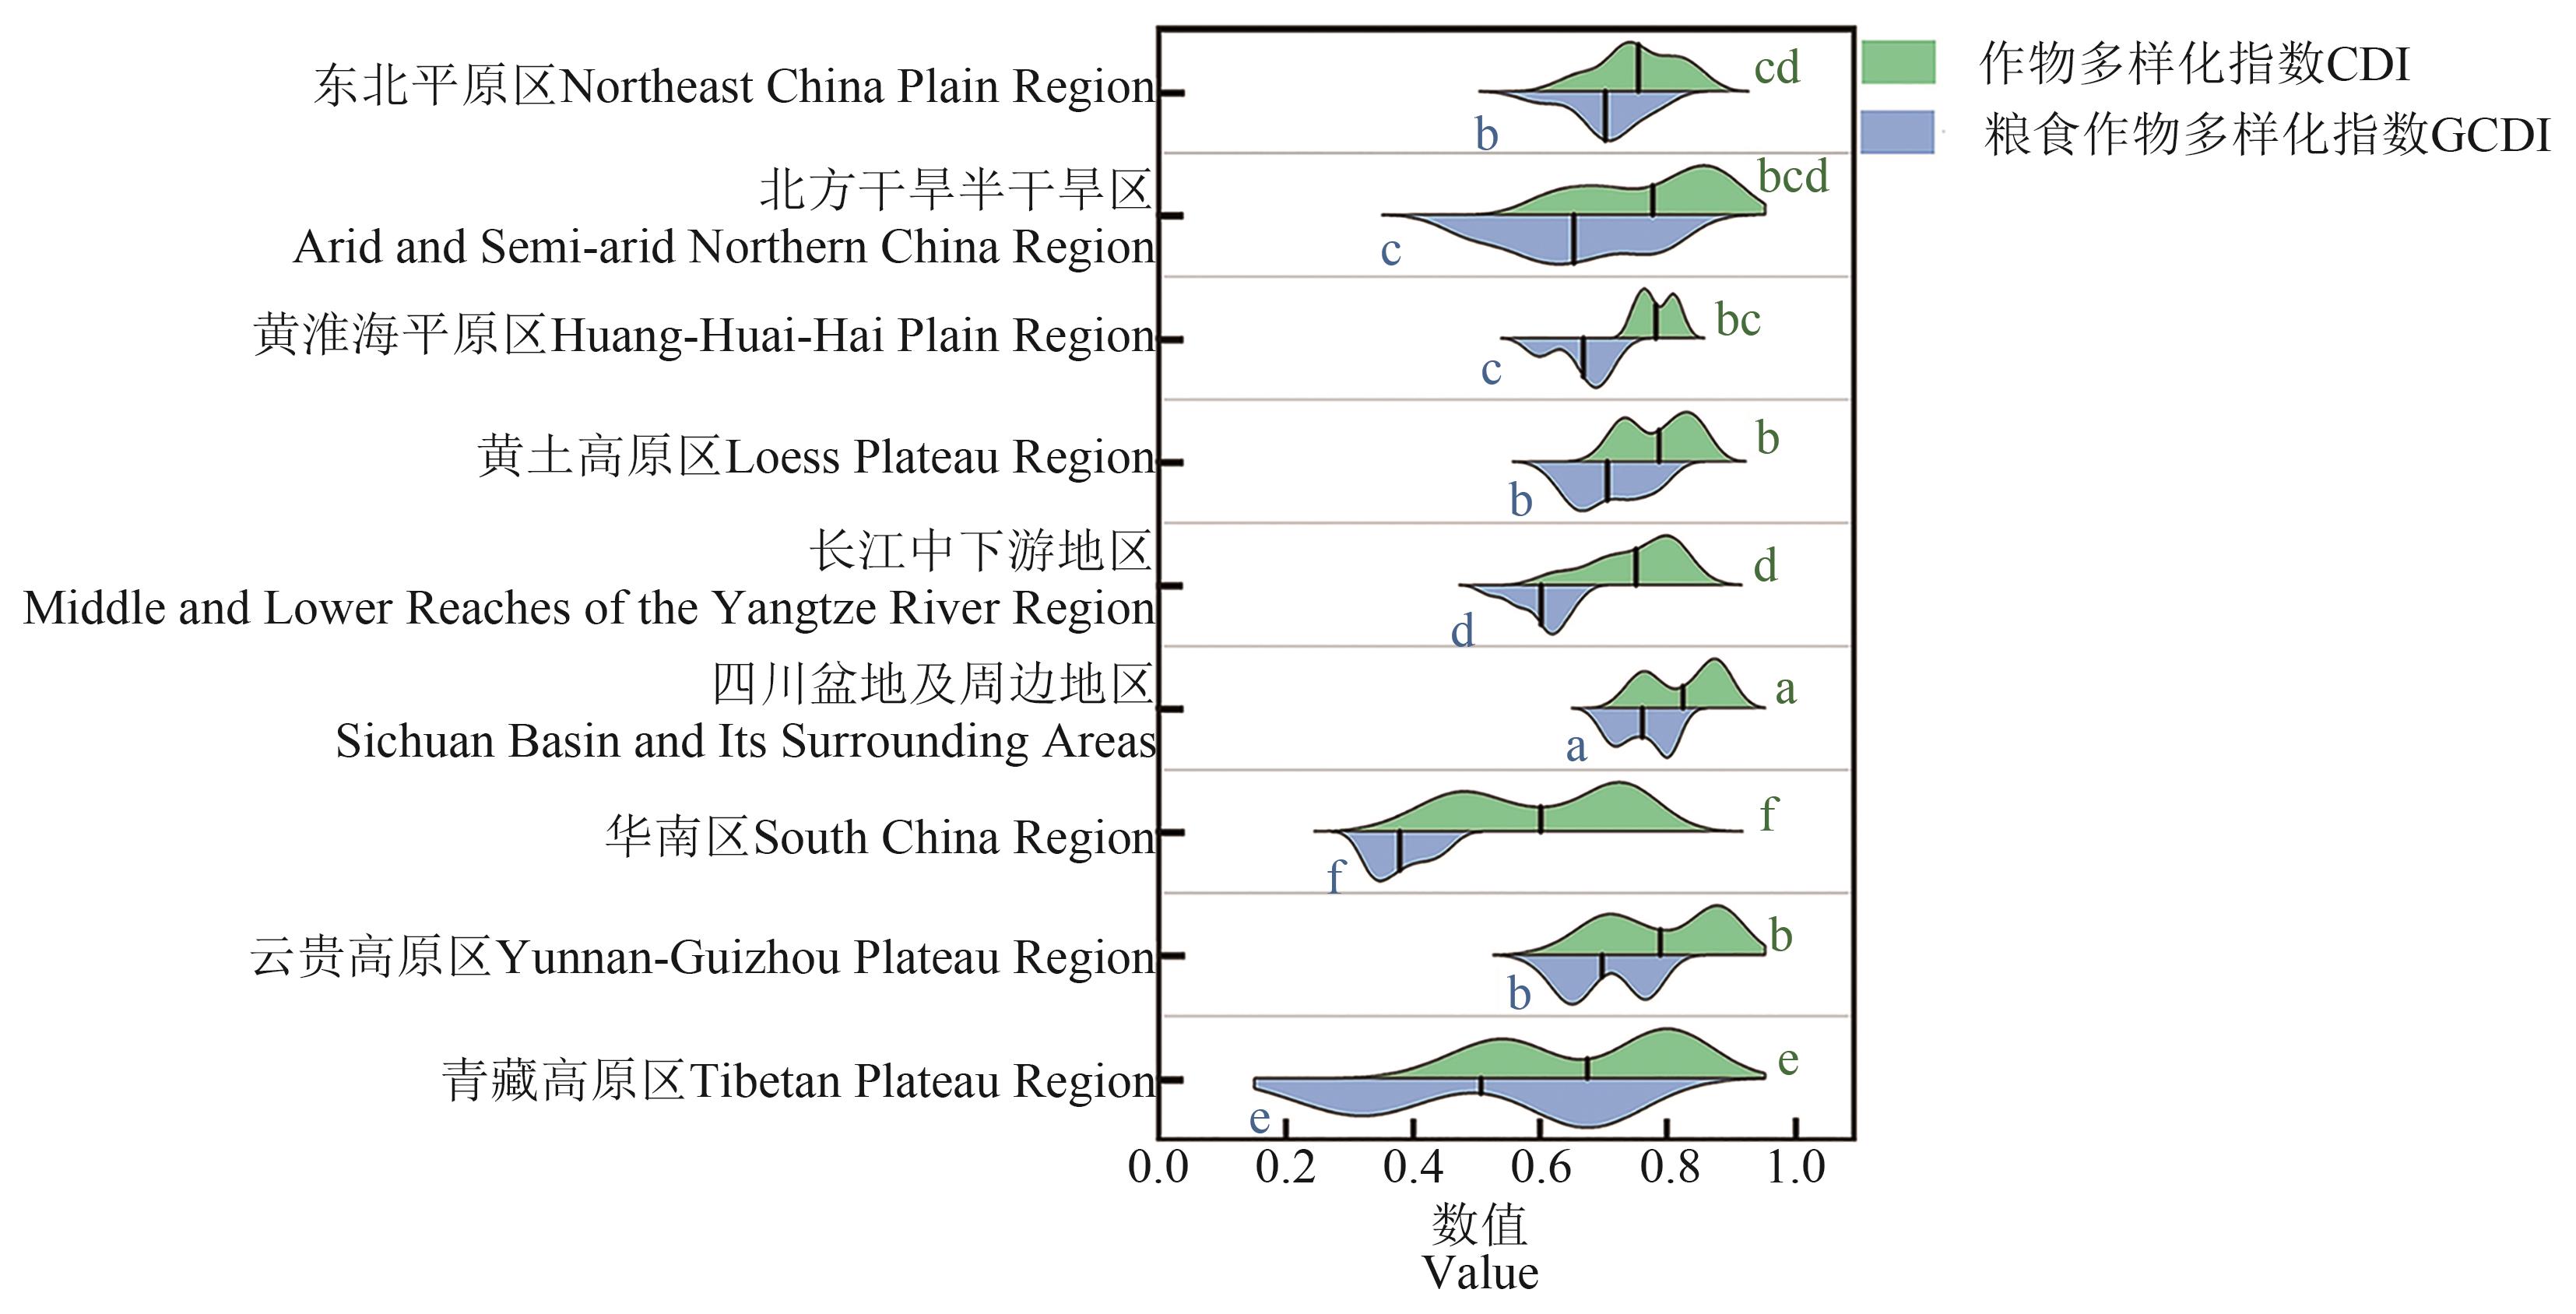
图4 1949—2021年主要农业区作物多样化空间异质性注:图内实线表示均值。不同小写字母表示不同农业区间在P<0.05水平差异显著。
Fig. 4 Spatial heterogeneity of the crop diversification in major agricultural regions from 1949 to 2021Note:The solid line in the graph shows the mean value. Different lowercase letters indicate significant differences between different agricultural regions at P<0.05 level.
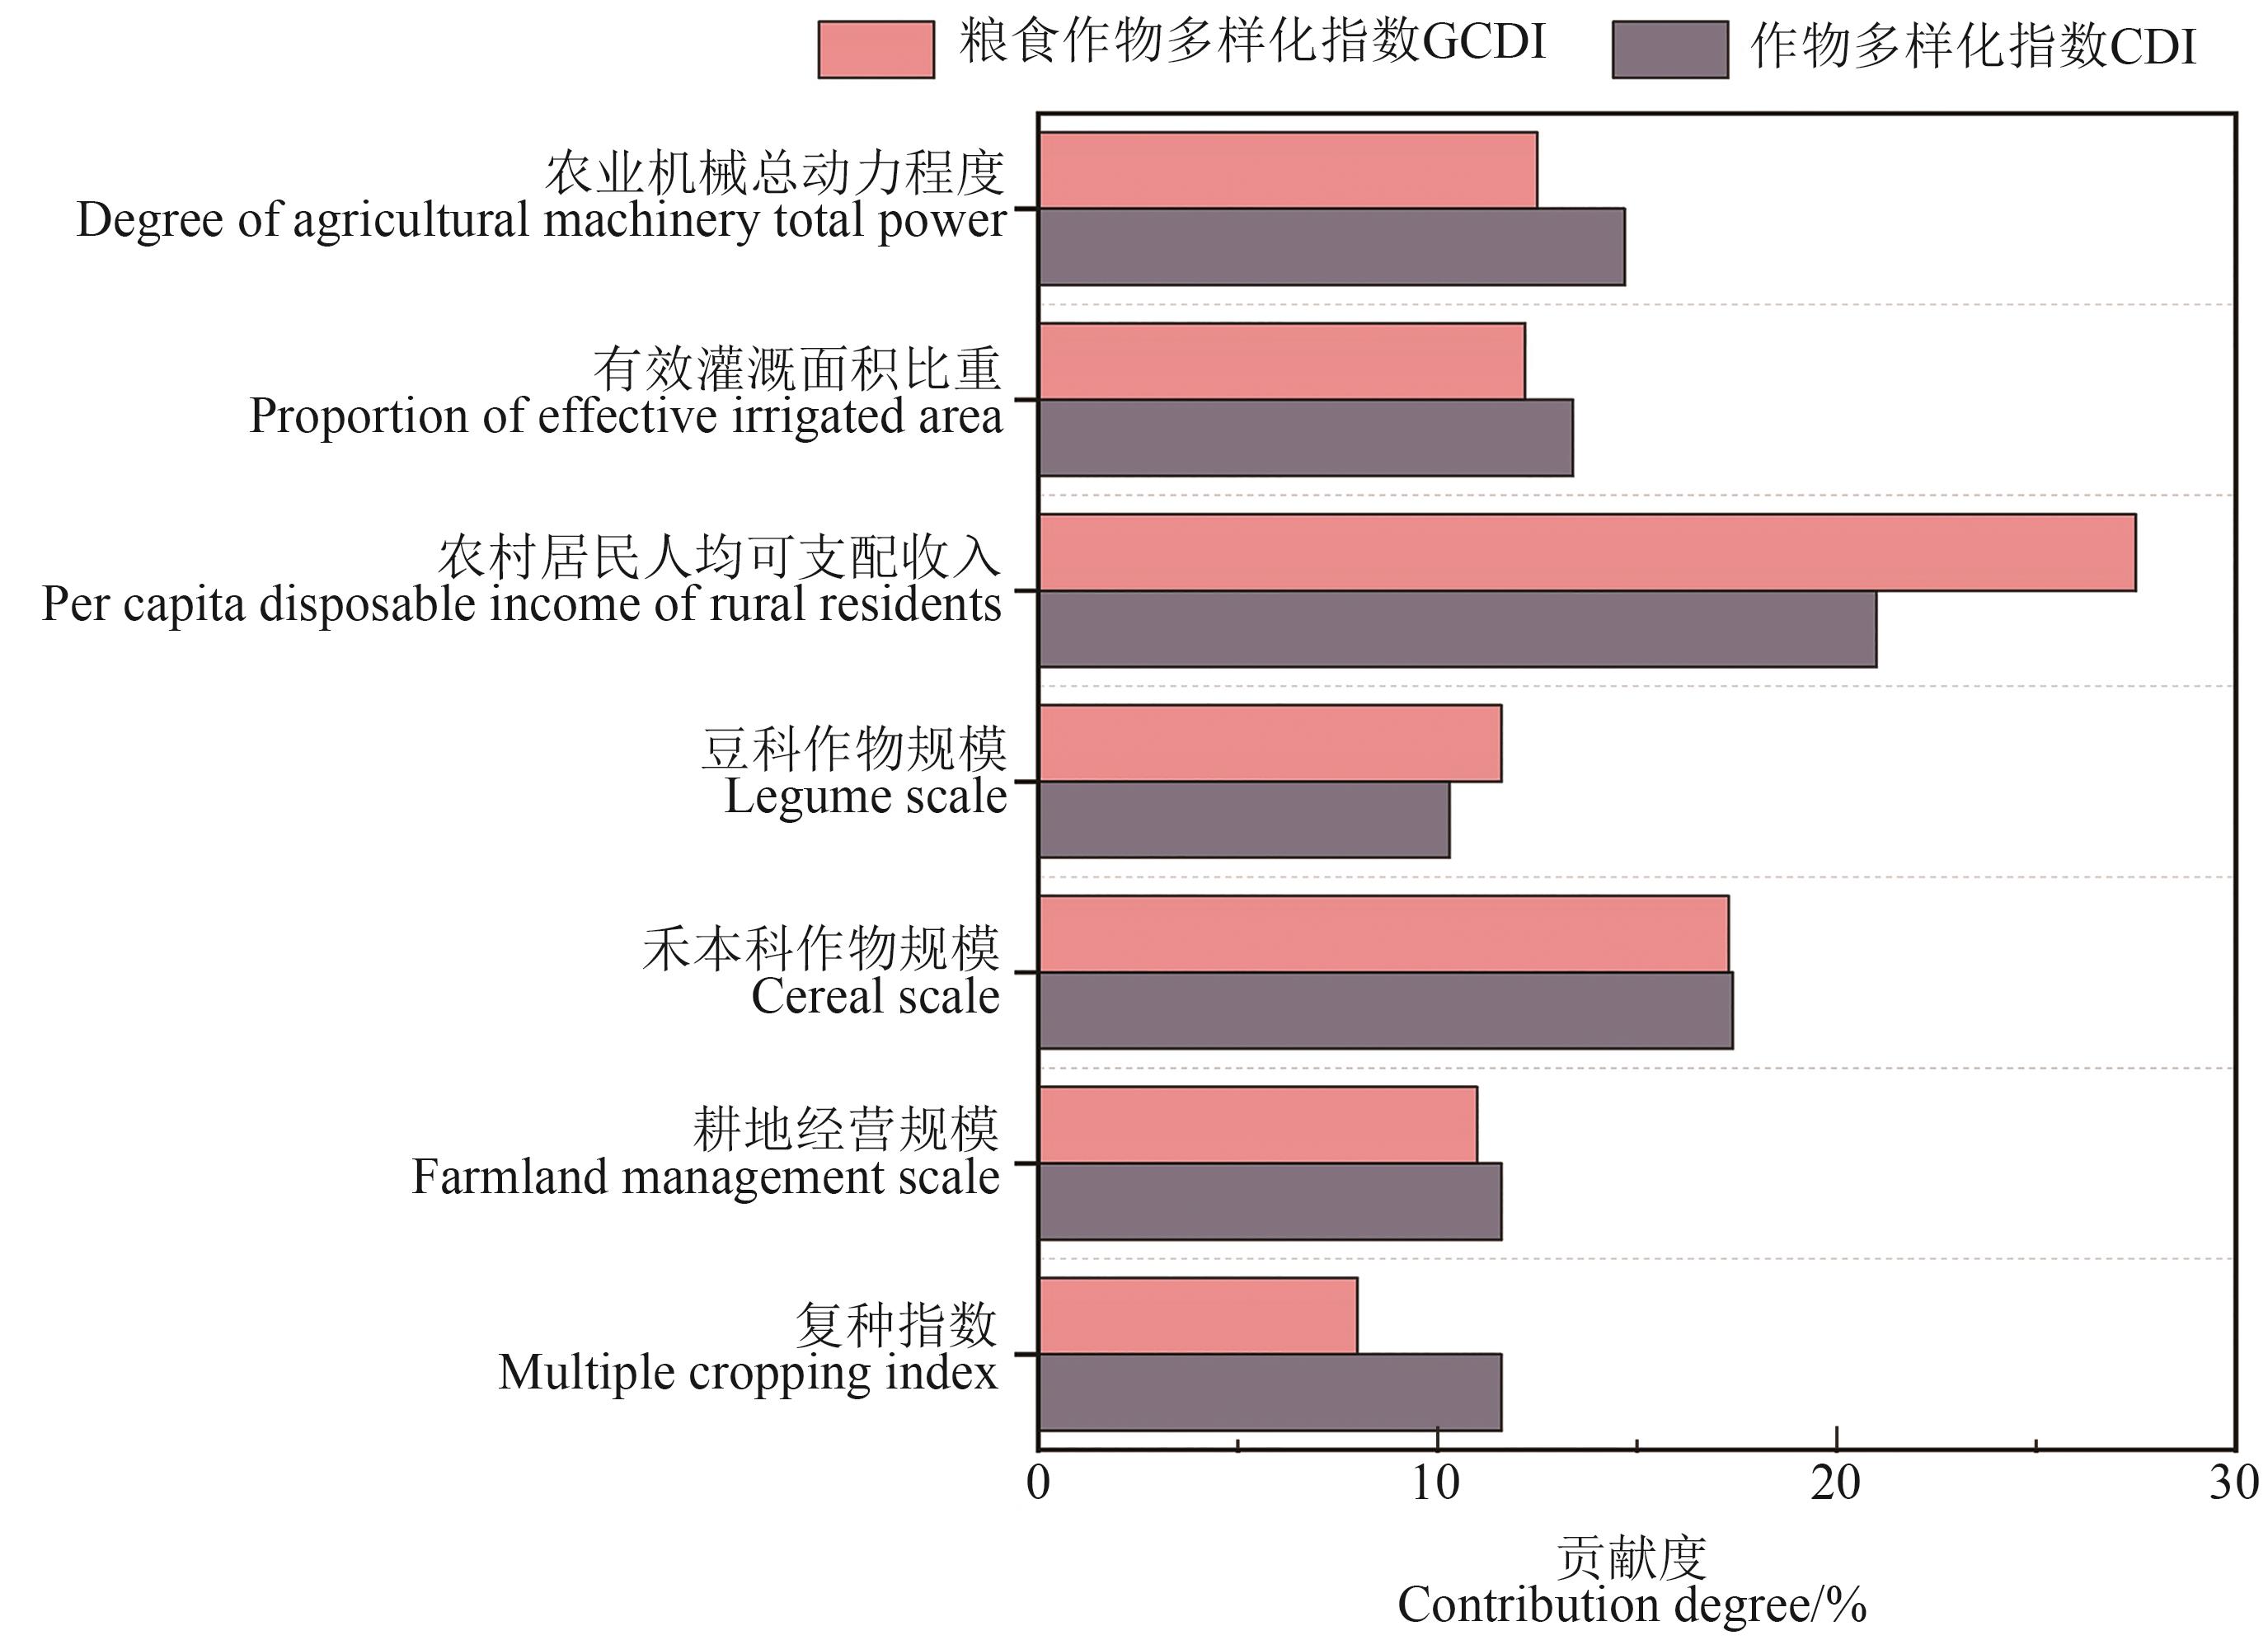
图5 全国作物和粮食作物多样化驱动因素的贡献度
Fig. 5 Contribution degree of driver factors for crop and grain crop diversification in China
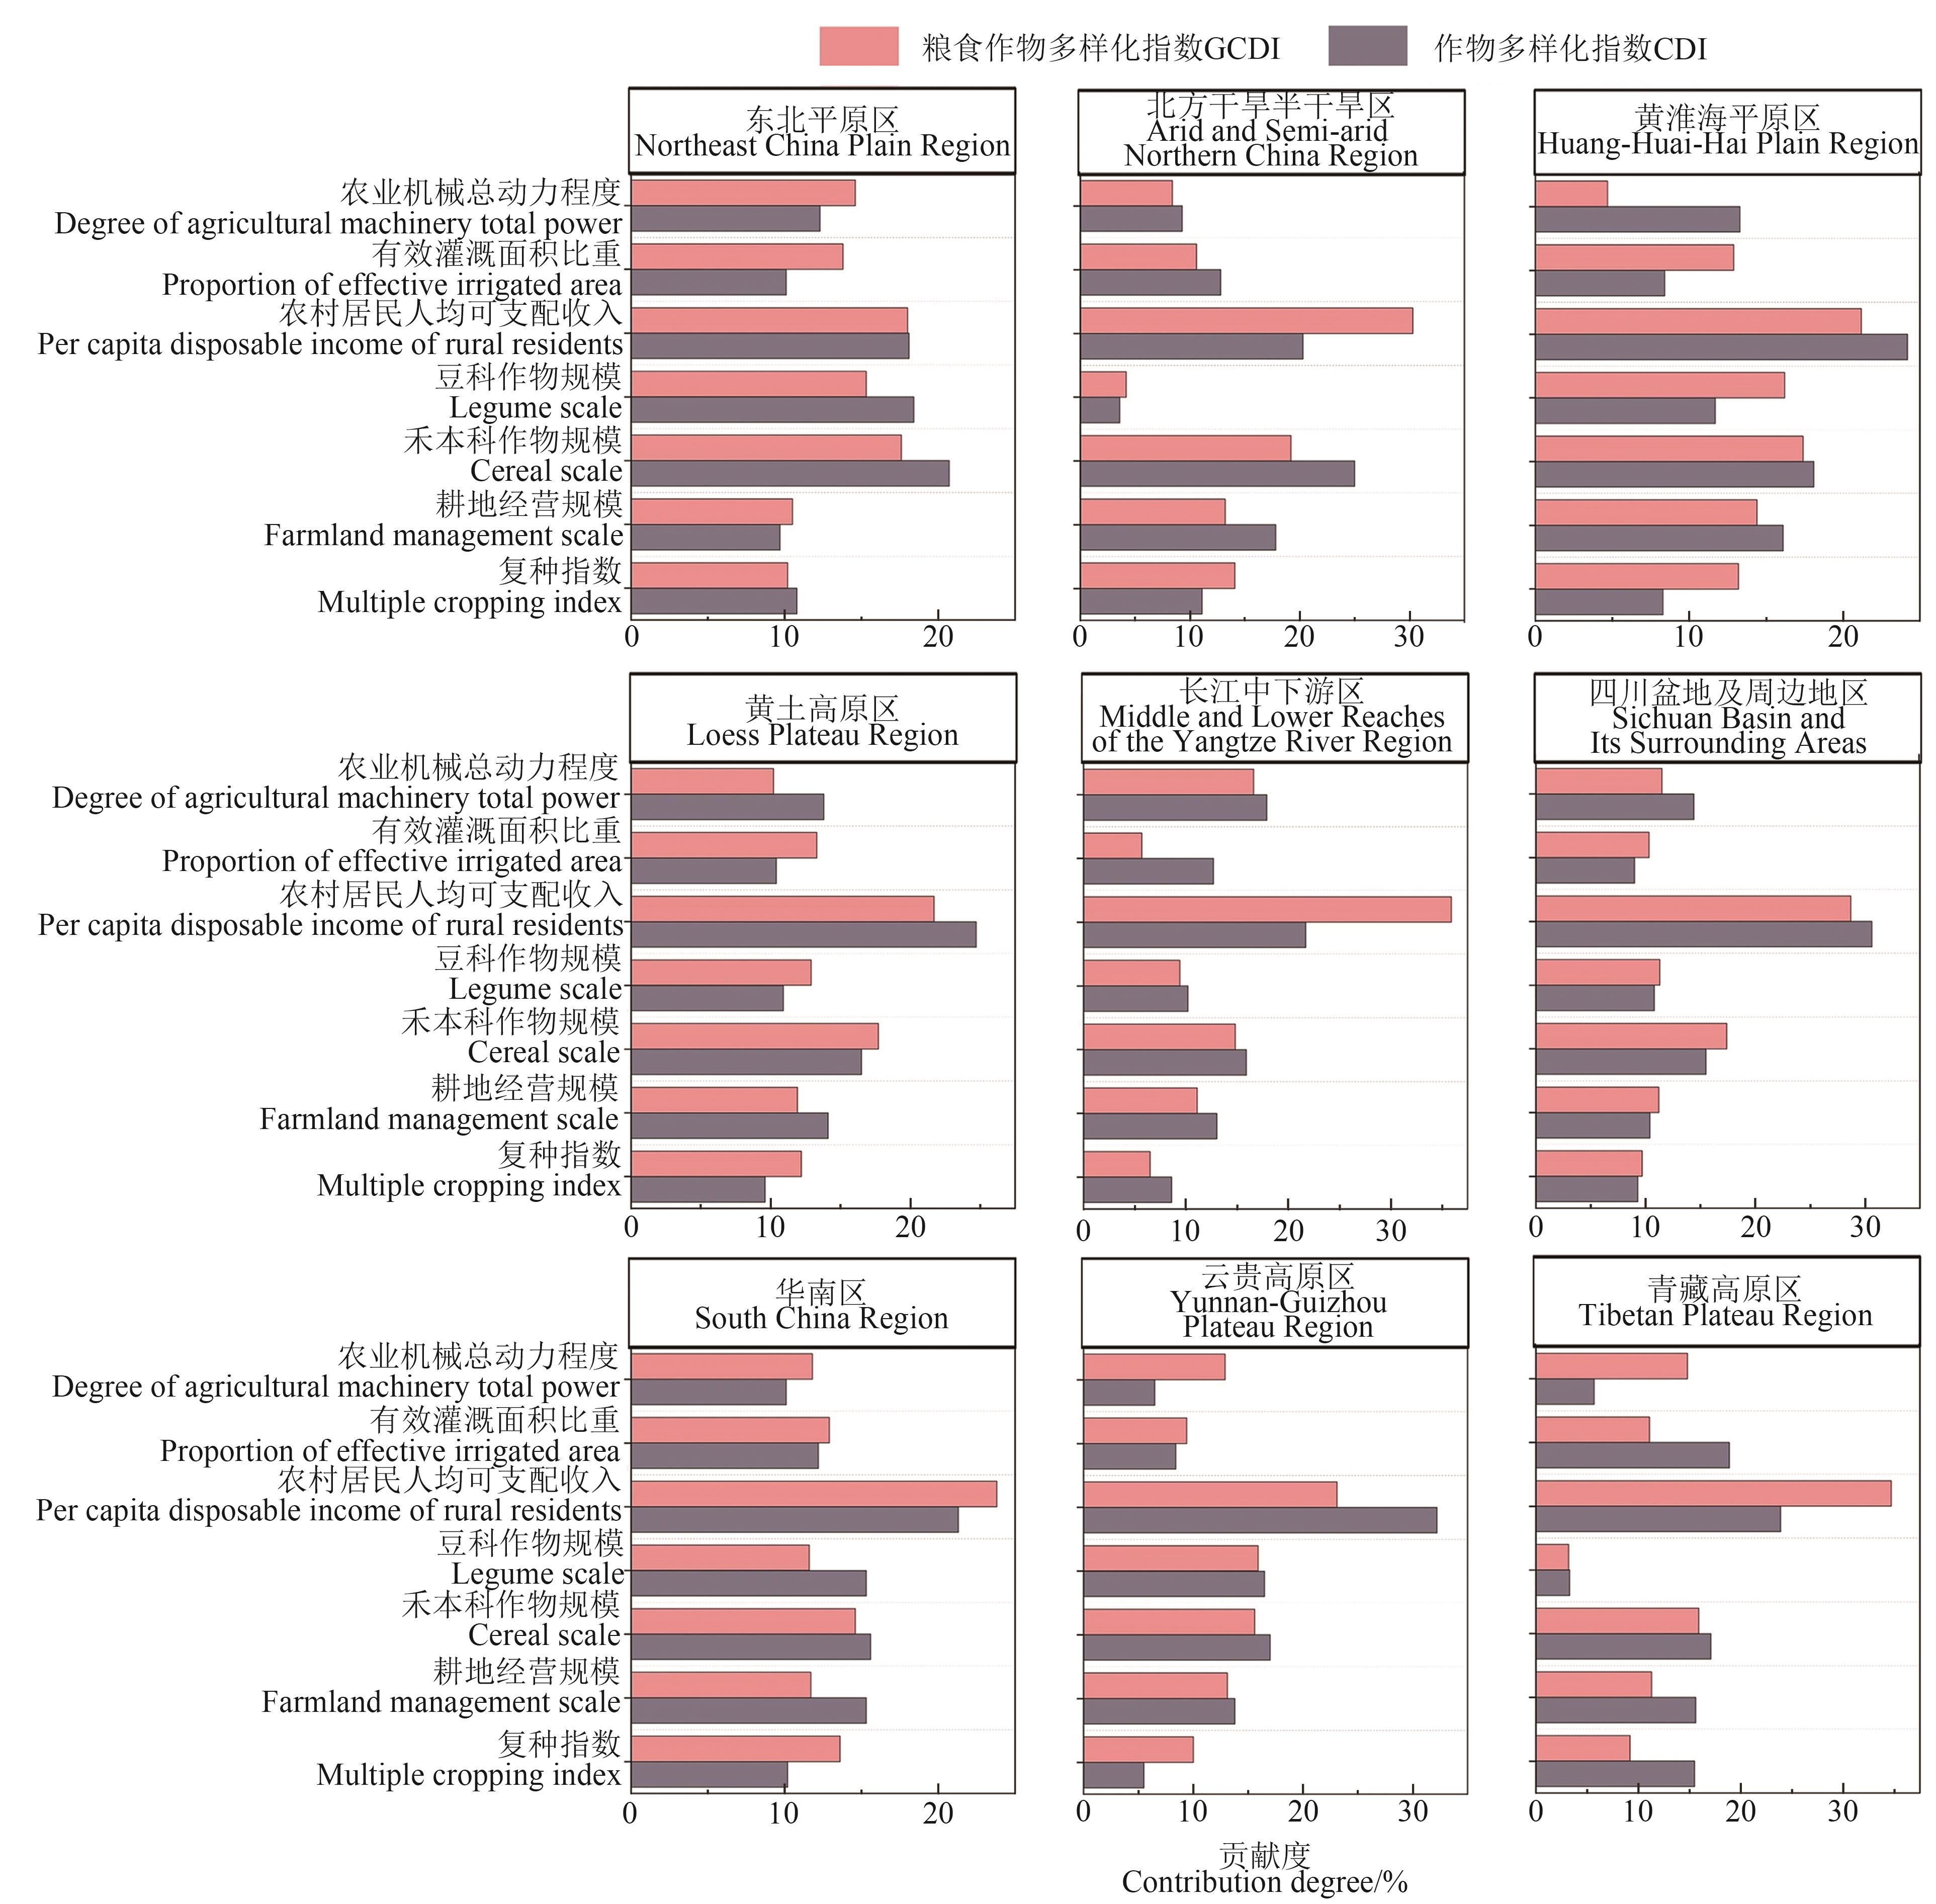
图6 主要农业区作物和粮食作物多样化驱动因素的贡献度
Fig. 6 Contribution degree of driver factors for crop and grain crop diversification in major agricultural regions
| 1 | DORLING D. World population prospects at the UN: our numbers are not our problem?[C]// The Struggle for Social Sustainability: Moral Conflicts in Global Social Policy [M]. UK: Policy Press, 2021:129-154. |
| 2 | DIJK M V, MORLEY T, RAU M L, et al.. A meta-analysis of projected global food demand and population at risk of hunger for the period 2010—2050 [J]. Nat. Food, 2021,2(7):494-501. |
| 3 | FOLEY J A, RAMANKUTTY N, BRAUMAN K A,et al..Solutions for a cultivated planet [J]. Nature, 2011,478:337-342. |
| 4 | MALHI G S, KAUR M, KAUSHIK P. Impact of climate change on agriculture and its mitigation strategies: a review [J/OL]. Sustainability, 2021, 13(3): 1318 [2024-01-06]. . |
| 5 | SADEGHPOUR A, HASHEM M, WEIS S A, et al.. Assessing tillage systems for reducing ammonia volatilization from spring-applied slurry manure [J]. Commun. Soil Sci. Plant Anal., 2015,46(6):724-735. |
| 6 | ER K H, LAU C, KASTNER T, et al.. Exploring the biophysical option space for feeding the world without deforestation [J/OL]. Nat. Commun., 2016, 7: 11382 [2024-01-06]. . |
| 7 | MATSON P A, PARTON W J, POWER A G, et al.. Agricultural intensification and ecosystem properties [J]. Science, 1997, 277(5325): 504-509. |
| 8 | GABA S, LESCOURRET F, BOUDSOCQ S,et al..Multiple cropping systems as drivers for providing multiple ecosystem services:from concepts to design [J]. Agron. Sustain. Dev., 2015,35(2):607-623. |
| 9 | DELL C J, HAN K, BRYANT R B, et al.. Nitrous oxide emissions with enhanced efficiency nitrogen fertilizers in a rainfed system [J]. J. Am. Soc. Agron., 2014,106(2):723-731. |
| 10 | KETTERINGS Q M, GODWIN G, BARNEY P,et al..Shallow mixing of surface soil and liquid dairy manure conserves nitrogen while retaining surface residue [J]. Agron. Sustain. Dev., 2013, 33(3): 507-517. |
| 11 | LI L, DER WERF W V, ZHANG F S. Crop diversity and sustainable agriculture: mechanisms, designs and applications [J]. Front. Agric. Sci. Eng., 2021,8(3):359-361. |
| 12 | XU Z, LI C, ZHANG C, et al.. Intercropping maize and soybean increases efficiency of land and fertilizer nitrogen use: a meta-analysis [J/OL]. Field Crops Res., 2020, 246: 107661[2024-01-06]. . |
| 13 | MARTIN-GUAY M O, PAQUETTE A, DUPRAS J, et al.. The new green revolution:sustainable intensification of agriculture by intercropping [J]. Sci. Total Environ., 2018, 615: 767-772. |
| 14 | TANG X Y, ZHANG C C, YU Y, et al.. Intercropping legumes and cereals increases phosphorus use efficiency;a meta-analysis [J]. Plant Soil, 2021,460(1):89-104. |
| 15 | LI C J, HOFFLAND E, KUYPER T W, et al.. Syndromes of production in intercropping impact yield gains [J]. Nat. Plants,2020, 6: 653-660. |
| 16 | SCHERF B D, ENG A, PILLING D. The Second Report on the State of the World’s Animal Genetic Resources for Food and Agriculture [M]. Rome: FAO, 2015. |
| 17 | 梁晓慧.中国农作物多样性及其保护现状[J].中国农业信息,2009 (4):10-12. |
| 18 | 苏海洋.论中国最早的农业多样化产生的地理背景及影响[J].农业考古,2015 (3):17-23 |
| 19 | 曾琳琳,李晓云,王砚.作物多样性变化及其对农业产出的影响——基于期望出产和非期望产出的分析[J].长江流域资源与环境,2019,28(6):1375-1385. |
| ZENG L L, LI X Y, WANG Y.Impact of crop diversity on agricultural output:based on the desirable and undesirable production [J]. Resour. Environ. Yangtze Basin,2019,28(6):1375-1385. | |
| 20 | JIANG Y, WANG X, HUO M, et al.. Changes of cropping structure lead diversity decline in China during 1985—2015 [J/OL]. J. Environ. Manage., 2023, 346:119051 [2024-01-06]. . |
| 21 | HIJMANS R J, CHOE H, PERLMAN J. Spatiotemporal patterns of field crop diversity in the united states: 1870—2012 [J/OL]. Agric. Environ. Lett., 2016, 1(1):160022 [2024-01-06]. . |
| 22 | MERLOS F A, HIJMANS R J.The scale dependency of spatial crop species diversity and its relation to temporal diversity [J].Proc. Natl. Acad. Sci. USA, 2020,117(42):26176-26182. |
| 23 | DENG X Z, GIBSON J, WANG P.Relationship between landscape diversity and crop production:a case study in the Hebei province of China based on multi-source data integration [J]. J. Clean. Prod., 2017,142: 985-992. |
| 24 | HE C Y, LIU Z F, XU M, et al.. Urban expansion brought stress to food security in China: evidence from decreased cropland net primary productivity [J]. Sci. Total Environ., 2017, 576: 660-670. |
| 25 | 石忆邵,吴婕.上海城乡经济多样化测度方法及其演变特征[J].经济地理,2015,35(2):7-13. |
| SHI Y S, WU J.Measuring methods and evolution features of urban-rural economic diversification in Shanghai [J].Econ. Geogr., 2015,35(2):7-13. | |
| 26 | 胡忆雨,邹军,吴尧,等.全球禾-豆生产系统作物多样性变化特征及其影响[J].中国农业大学学报,2021,26(8):9-22. |
| HU Y Y, ZOU J, WU Y, et al.. Changes and impacts of crop diversity in global cereal-legume production systems [J].J.China Agric. Univ., 2021,26(8):9-22. | |
| 27 | HAWKINS D M, ZAMBA K. A change-point model for a shift in variance [J]. J. Qual. Technol., 2005,37(1):21-31. |
| 28 | HAWKINS D M, QIU P, KANG C W. The changepoint model for statistical process control [J]. J. Qual. Technol., 2003,35(4):355-366. |
| 29 | ROSS G J. Parametric and nonparametric sequential change detection in R: the cpm package [J]. J. Stat. Softw., 2015,66(3):1-20. |
| 30 | BREIMAN L. Random forests [J]. Mach. Learning, 2001,45:5-32. |
| 31 | 李旭青,刘湘南,刘美玲,等.水稻冠层氮素含量光谱反演的随机森林算法及区域应用[J].遥感学报,2014,18(4):923-945. |
| LI X Q, LIU X N, LIU M L, et al.. Random forest algorithm and regional applications of spectral inversion model for estimating canopy nitrogen concentration in rice [J].Natl. Remote. Sens.Bull., 2014,18(4):923-945. | |
| 32 | ANTOINE M, LOIC V, LISE P, et al.. Enabling crop diversification to support transitions toward more sustainable european agrifood systems [J]. Front. Agric. Sci. Eng., 2021,8(3): 474-480. |
| 33 | DELPHINE R, LUCIE M, FREDERIK N. Crop diversity buffers the impact of droughts and high temperatures on food production [J/OL]. Environ. Res. Lett., 2023,18(4):045002 [2024-01-06]. . |
| 34 | TILMAN D, REICH P B, KNOPS J,et al..Diversity and productivity in a long-term grassland experiment [J].Science, 2001,294(5543):843-845. |
| 35 | ZHANG Y H, WU Y, YAN J Z,et al..How does rural labor migration affect crop diversification for adapting to climate change in the Hehuang Valley,Tibetan Plateau? [J/OL].Land Use Policy,2022,113:105928 [2024-01-06]. . |
| 36 | 屈宝香.中国农作物多样化发展综述[J].中国人口∙资源与环境,2001,11():119-121. |
| QU B X. Overview on the development of crop diversification in China [J]. China J. Popul. Resour. Environ., 2001,11(S1),119-121. | |
| 37 | LIU Z H, YANG P, WU W B,et al.. Spatiotemporal changes of cropping structure in China during 1980—2011 [J].J.Geogr.Sci., 2018,28(11):1659-1671. |
| 38 | 关浩杰,司喜梅.黄淮海平原粮食生产空间格局演化及其影响因素[J].中国农业资源与区划,2024, 45(8):31-43. |
| GUAN H J, SI X M. Evolution and influence factors of the spatial pattern of grain production in the Huang-Huai-Hai Plain [J]. Chin. J. Agric. Resour. Reg. Plan., 2024, 45(8):31-43. | |
| 39 | CONG W F, ZHANG C C, LI C J, et al.. Designing diversifies cropping systems in China: theory, approaches and implementation [J]. Front. Agric. Sci. Eng., 2021,8(3):362-372. |
| 40 | DU J B, HAN T F, GAI J Y,et al..Maize-soybean strip intercropping:achieved a balance between high productivity and sustainability [J]. J. Integr. Agric., 2018,17(4):747-754. |
| 41 | TANG C Z, YI Y Y, KUANG Y N. Research on spatio-temporal complexity evolution and influencing factors of “Nongrain” in Guangxi [J/OL]. Discrete Dyn. Nat. Soc., 2022,14:1181108 [2024-01-06]. . |
| 42 | 张婕,刘玉洁,张二梅,等.中国县域耕地动态演变及其驱动机制[J].地理学报,2023,78(9):2105-2127. |
| ZHANG J, LIU Y J, ZHANG E M, et al.. Dynamics and driving mechanisms of cultivated land at county level in China [J].Acta Geogr. Sin., 2023,78(9):2105-2127. | |
| 43 | GENIS S M, MORITZ R, JORGE L, et al.. A win-win situation-increasing protein production and reducing synthetic N fertilizer use by integrating soybean into irrigated Mediterranean cropping systems [J/OL]. Eur. J. Agron., 2023,146:126817 [2024-01-06]. . |
| 44 | STROUWEN C, MOLENAAR E A L M, MÜNKS L, et al.. Training dual tasks together or apart in Parkinson’s disease:results from the DUALITY trial [J].Mov.Disord.,2017,32(8):1201-1210. |
| 45 | AIHOUNTON G, CHRISTIAENSEN L.Does agricultural intensification pay in the context of structural transformation? [J/OL].Food Policy,2024,122:102571 [2024-01-06]. . |
| 46 | LI Z B, LIU Z B, LI P, et al.. Comparing watershed afforestation and natural revegetation impacts on soil moisture in the semiarid Loess Plateau of China [J/OL]. Sci. Rep., 2018,8: 2972 [2024-01-06]. . |
| 47 | LIU Z H, TANG G P, ZHOU Y, et al.. Why can China maintain a high crop diversity? a spatial-temporal dynamic analysis [J/OL]. Prog. Phys. Geogr., 2021,46(2): 55850 [2024-01-06]. . |
| 48 | 徐峰,孔凡磊,姜宜琛,等.西南地区玉米增产潜力与机械化支撑能力研究[J].中国农机化学报,2023,44(12):223-231. |
| XU F, KONG F L, JIANG Y C, et al.. Study on maize yield increase potential and mechanized support capacity in Southwest China [J]. J. Chin. Agric. Mech., 2023,44(12):223-231. | |
| 49 | 崔文芳,秦德志,陈静,等.玉米大豆不同间作系统光合特性与产量边际效应[J].农业机械学报,2023,54(8):309-319. |
| CUI W F, QIN D Z, CHEN J,et al.. Marginal effects of photosynthetic characteristics and yield in maize and soybean intercropping systems [J]. Trans. Chin. Soc. Agric. Mach., 2023,54(8):309-319. | |
| 50 | LI Z P, LONG Y Q, TANG P Q, et al.. Spatio-temporal changes in rice area at the northern limits of the rice cropping system in China from 1984 to 2013 [J]. J. Integr. Agric., 2017,16(2):360-367. |
| [1] | 内蒙古中部区干旱指数演变及其对马铃薯产量的影响. 内蒙古中部区干旱指数演变及其对马铃薯产量的影响[J]. 中国农业科技导报, 2021, 23(10): 161-170. |
| [2] | 李阔,许吟隆*. 适应气候变化的中国农业种植结构调整研究[J]. 中国农业科技导报, 2017, 19(1): 8-17. |
| [3] | 闫琰1§,宋莉莉2§,王秀东2*. 我国粮食“十一连增”主要因素贡献分析及政策思考[J]. 中国农业科技导报, 2016, 18(6): 1-8. |
| [4] | 袁璋[1] 许越先[1] 刘爱军[2]. 我国经济作物种植结构的近期变化[J]. , 2005, 7(5): 39-45. |
| [5] | 张士功[1] 周应华[2] 等. 我国大豆生产与基地建设[J]. , 2001, 3(1): 68-72. |
| [6] | 杨金深 于慧丰. 河北省粮食增长贡献因素分析与增效途径[J]. , 2000, 2(3): 53-57. |
| 阅读次数 | ||||||
|
全文 |
|
|||||
|
摘要 |
|
|||||
 京公网安备11010802021197号