


中国农业科技导报 ›› 2023, Vol. 25 ›› Issue (8): 138-147.DOI: 10.13304/j.nykjdb.2022.0090
• 生物制造 资源生态 • 上一篇
赵明宇1( ), 贾浩2, 石晓宇1, 潘义1, 黄妤韵1, 王凯澄1, 褚庆全1()
收稿日期:2022-02-07
接受日期:2022-03-27
出版日期:2023-08-20
发布日期:2023-09-07
通讯作者:
褚庆全
作者简介:赵明宇 E-mail:1352445828@qq.com;
基金资助:
Mingyu ZHAO1(), Hao JIA2, Xiaoyu SHI1, Yi PAN1, Yuyun HUANG1, Kaicheng WANG1, Qingquan CHU1()
Received:2022-02-07
Accepted:2022-03-27
Online:2023-08-20
Published:2023-09-07
Contact:
Qingquan CHU
摘要:
为量化冬小麦生产对水资源的消耗,基于水足迹理论和方法,在县域尺度上,科学分析了1985—2015年黄淮海农作区冬小麦生产水足迹的时空分布和变化特征,并对水足迹冷热点分布趋势进行了探讨。结果表明,黄淮海农作区冬小麦水足迹总量为1 168.54×10⁸ m3,在空间上呈现南部区域高、北部区域低的特点。冬小麦蓝水足迹呈现北高南低的空间格局,而绿水和灰水足迹则表现为南高北低。1985—2015年,黄淮海农作区冬小麦水足迹增加了54.8%,其中蓝水足迹和绿水足迹变化较小,而灰水足迹的占比增加了29.1%;空间分布上蓝、绿、灰水足迹均呈现北部降低、南部升高的变化趋势。冬小麦水足迹总量的重心呈现向西南方向迁移的趋势,但整体变化幅度较小。近30年冬小麦水足迹在全局和局部均呈现空间集聚趋势,热点区域在2.5亚区扩大,冷点区域在2.2亚区扩大。以上研究结果为黄淮海农作区冬小麦布局优化和农业水资源高效利用与管理提供了科学依据。
中图分类号:
赵明宇, 贾浩, 石晓宇, 潘义, 黄妤韵, 王凯澄, 褚庆全. 近30年黄淮海农作区冬小麦水足迹分布变化[J]. 中国农业科技导报, 2023, 25(8): 138-147.
Mingyu ZHAO, Hao JIA, Xiaoyu SHI, Yi PAN, Yuyun HUANG, Kaicheng WANG, Qingquan CHU. Distribution of Winter Wheat Water Footprint in Huang-Huai-Hai Farming Region in Recent 30 Years[J]. Journal of Agricultural Science and Technology, 2023, 25(8): 138-147.
亚区编号 Sub-zone code | 亚区名称 Sub-zone name | 海拔 Elevation/m | 年均温 Annual mean temperature/℃ | ≥10℃积温 ≥10 ℃ accumulated temperature/℃ | 无霜期 Frost-free season/d | 年均降雨量 Annual mean rainfall/mm |
|---|---|---|---|---|---|---|
| 2.1 | 环渤海山东半岛滨海外向型二熟农渔区 Export-oriented double cropping agricultural and fishing region in Shandong Peninsula coast around Bohai | 0~40 | 11~14 | 4 000~4 500 | 180~220 | 600~1 000 |
| 2.2 | 燕山太行山山前平原水浇地二熟区 Irrigated double cropping plain in piedmonts of Taihang Mountain and Yan Mountain | 70~100 | 10~14 | 4 000~4 600 | 180~200 | 550~650 |
| 2.3 | 海河低平原缺水水浇地二熟兼旱地一熟区 Irrigated double cropping region and drought one cropping region in the lower Haihe Plain; | 10~30 | 12~13 | 4 200~4 500 | 180~195 | 500~600 |
| 2.4 | 鲁西平原鲁中丘陵水浇地二熟兼一熟区 Irrigated and drought double cropping region in the west plain and the middle hills of Shandong | 20~60 | 11~14 | 3 600~4 600 | 185~210 | 600~800 |
| 2.5 | 黄淮平原南阳盆地水浇地旱地二熟区 Irrigated and drought double cropping region in the Nanyang Basin of the Huang-Huai Plain | 70~40 | 14~15 | 4 500~4 800 | 205~220 | 650~950 |
| 2.6 | 汾渭谷地水浇地二熟旱地一熟兼二熟区 Irrigated double cropping region and drought one and double cropping regions in the Fenwei Valley; | 400~600 | 8~13 | 3 500~4 500 | 190~210 | 460~700 |
| 2.7 | 豫西丘陵山地旱坡地一熟水浇地二熟区 Drought sloping region of one cropping system and irrigated double cropping region in the west hills of Henan Province. | 300~800 | 12~15 | 3 800~4 800 | 190~230 | 550~650 |
| 全区Total zone | 0~800 | 8~15 | 3 500~4 800 | 180~230 | 460~1 000 | |
表1 黄淮海农作区亚区地形气候特征[17]
Table 1 Topographic and climatic characteristics of sub-regions in Huang-Huai-Hai farming region [17]
亚区编号 Sub-zone code | 亚区名称 Sub-zone name | 海拔 Elevation/m | 年均温 Annual mean temperature/℃ | ≥10℃积温 ≥10 ℃ accumulated temperature/℃ | 无霜期 Frost-free season/d | 年均降雨量 Annual mean rainfall/mm |
|---|---|---|---|---|---|---|
| 2.1 | 环渤海山东半岛滨海外向型二熟农渔区 Export-oriented double cropping agricultural and fishing region in Shandong Peninsula coast around Bohai | 0~40 | 11~14 | 4 000~4 500 | 180~220 | 600~1 000 |
| 2.2 | 燕山太行山山前平原水浇地二熟区 Irrigated double cropping plain in piedmonts of Taihang Mountain and Yan Mountain | 70~100 | 10~14 | 4 000~4 600 | 180~200 | 550~650 |
| 2.3 | 海河低平原缺水水浇地二熟兼旱地一熟区 Irrigated double cropping region and drought one cropping region in the lower Haihe Plain; | 10~30 | 12~13 | 4 200~4 500 | 180~195 | 500~600 |
| 2.4 | 鲁西平原鲁中丘陵水浇地二熟兼一熟区 Irrigated and drought double cropping region in the west plain and the middle hills of Shandong | 20~60 | 11~14 | 3 600~4 600 | 185~210 | 600~800 |
| 2.5 | 黄淮平原南阳盆地水浇地旱地二熟区 Irrigated and drought double cropping region in the Nanyang Basin of the Huang-Huai Plain | 70~40 | 14~15 | 4 500~4 800 | 205~220 | 650~950 |
| 2.6 | 汾渭谷地水浇地二熟旱地一熟兼二熟区 Irrigated double cropping region and drought one and double cropping regions in the Fenwei Valley; | 400~600 | 8~13 | 3 500~4 500 | 190~210 | 460~700 |
| 2.7 | 豫西丘陵山地旱坡地一熟水浇地二熟区 Drought sloping region of one cropping system and irrigated double cropping region in the west hills of Henan Province. | 300~800 | 12~15 | 3 800~4 800 | 190~230 | 550~650 |
| 全区Total zone | 0~800 | 8~15 | 3 500~4 800 | 180~230 | 460~1 000 | |
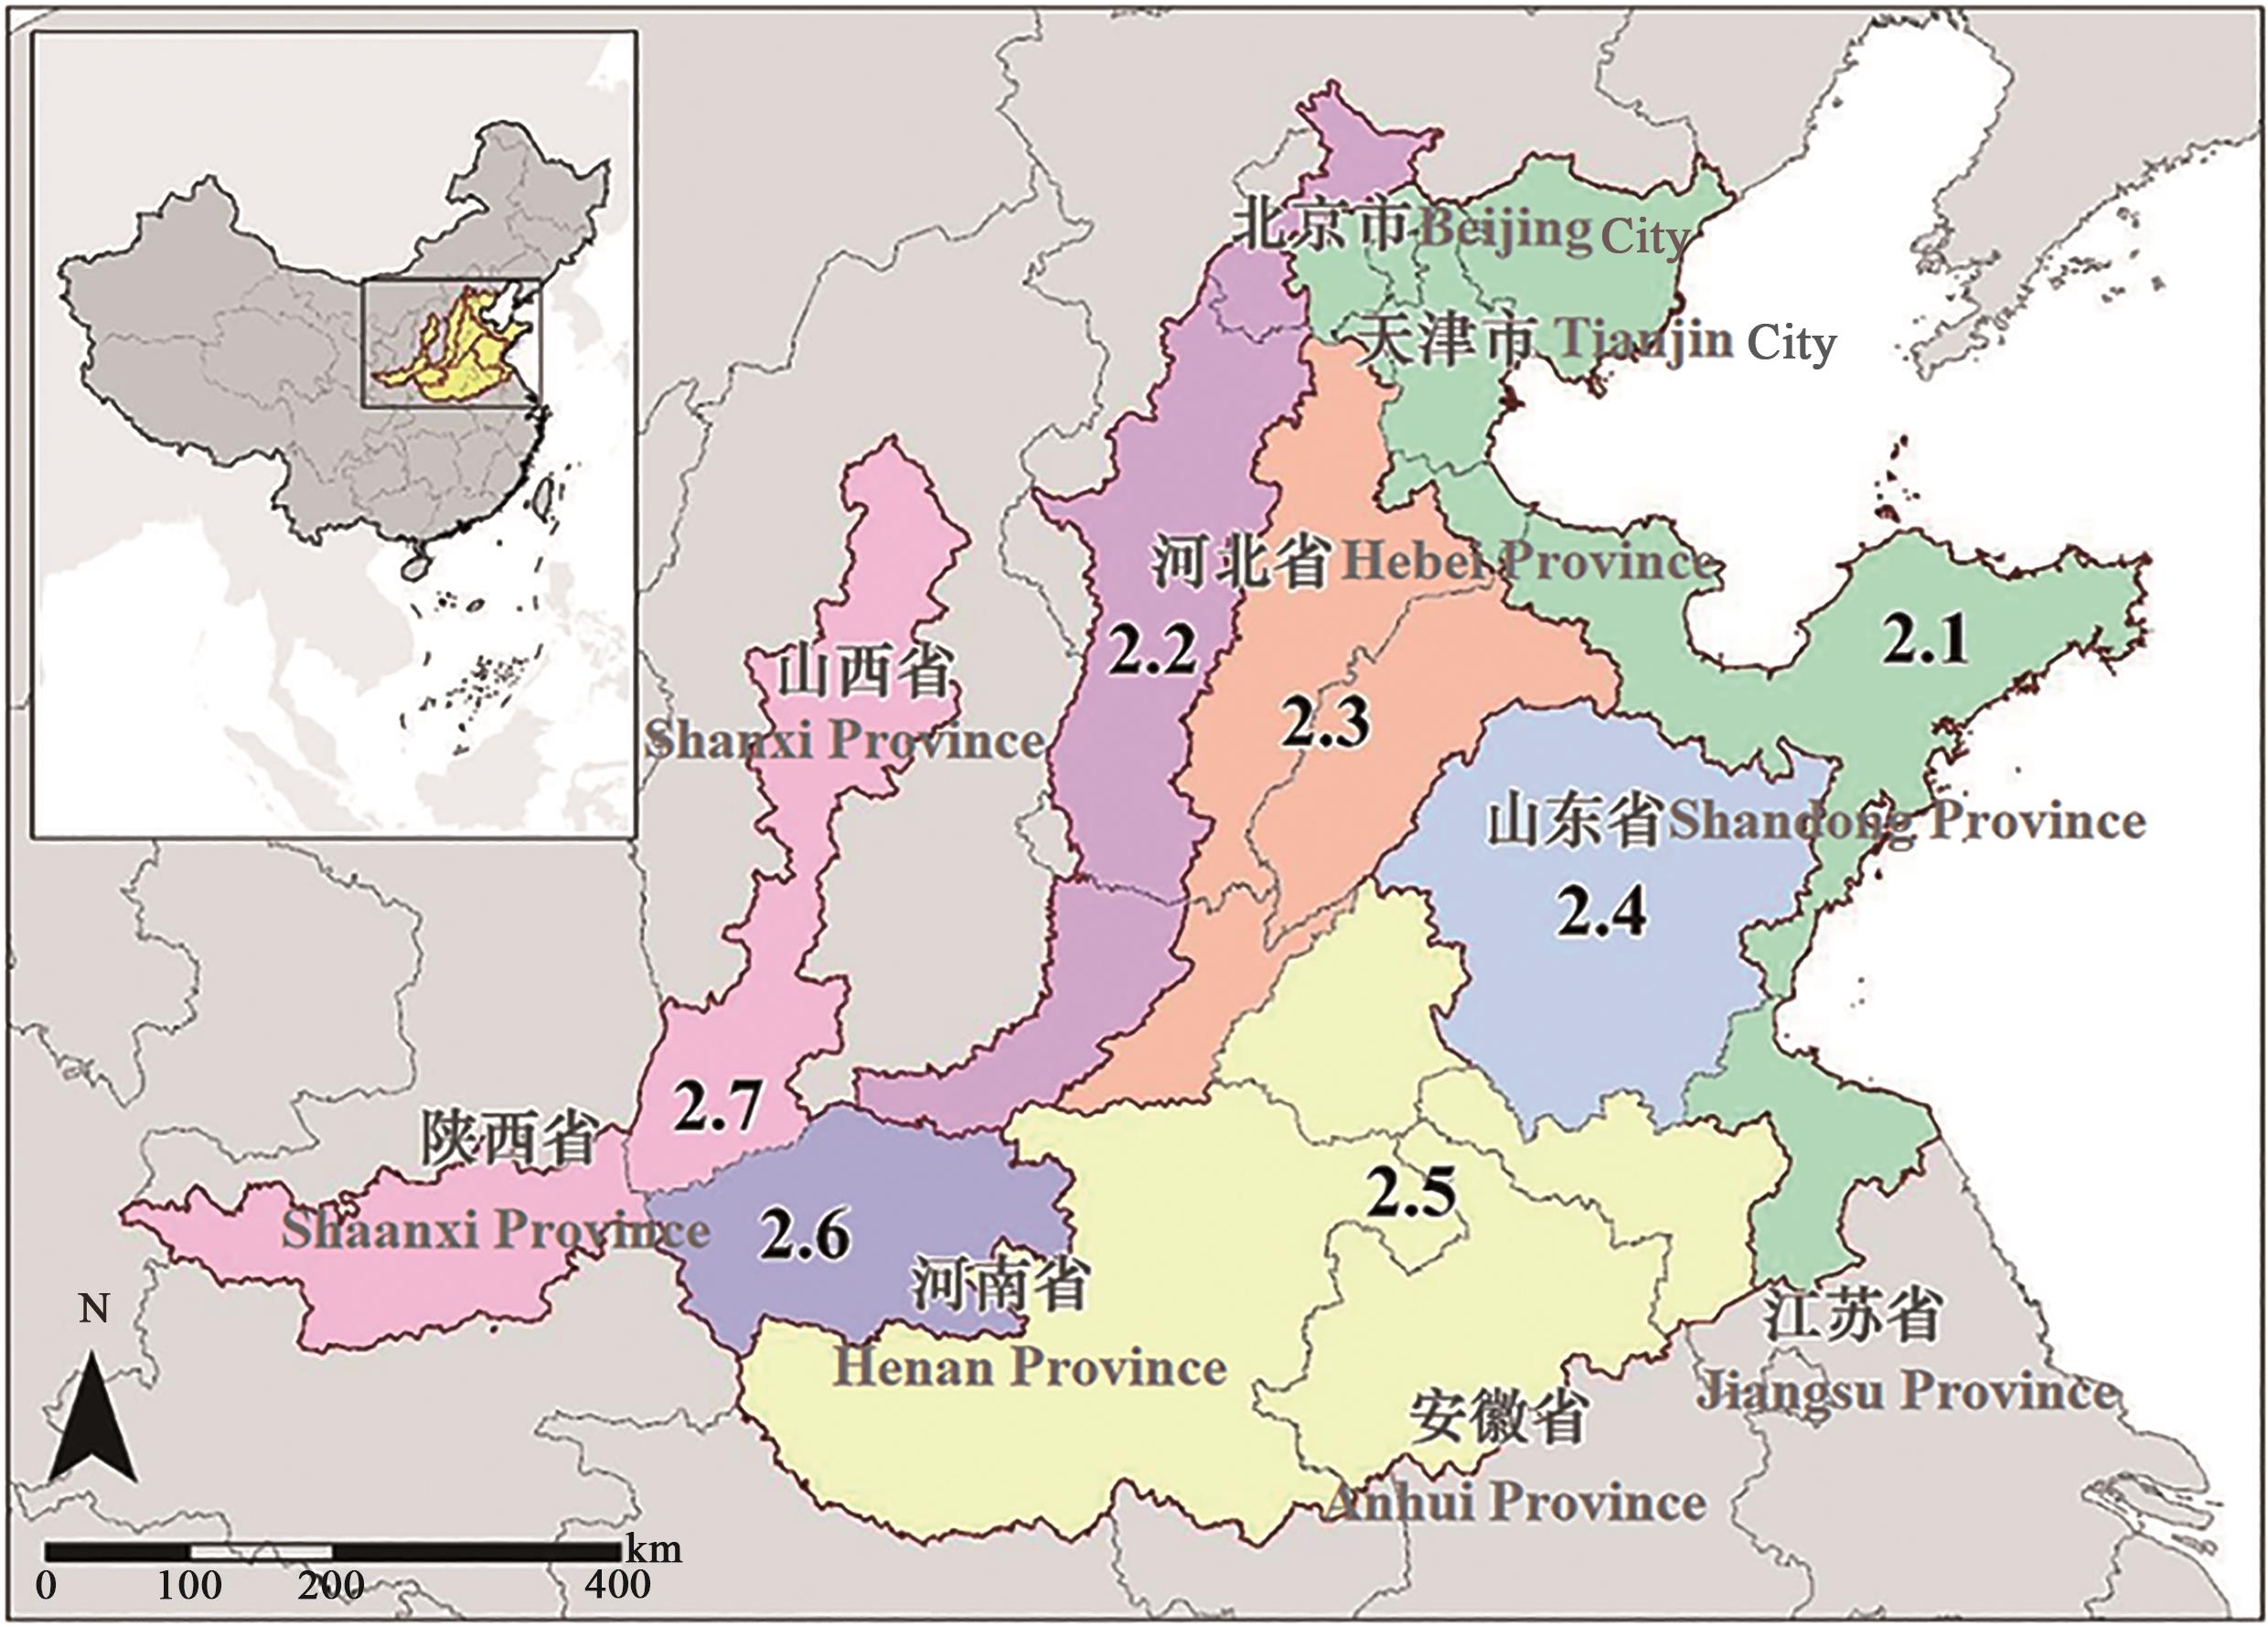
图1 黄淮海农作区亚区分区注:审图号为GS(2019)1822;图中亚区编号同表1。
Fig. 1 Distribution of Huang-Huai-Hai farming region and sub-zonesNote:The map number is GS(2019)1822; Code of sub-zone is same to Table 1.
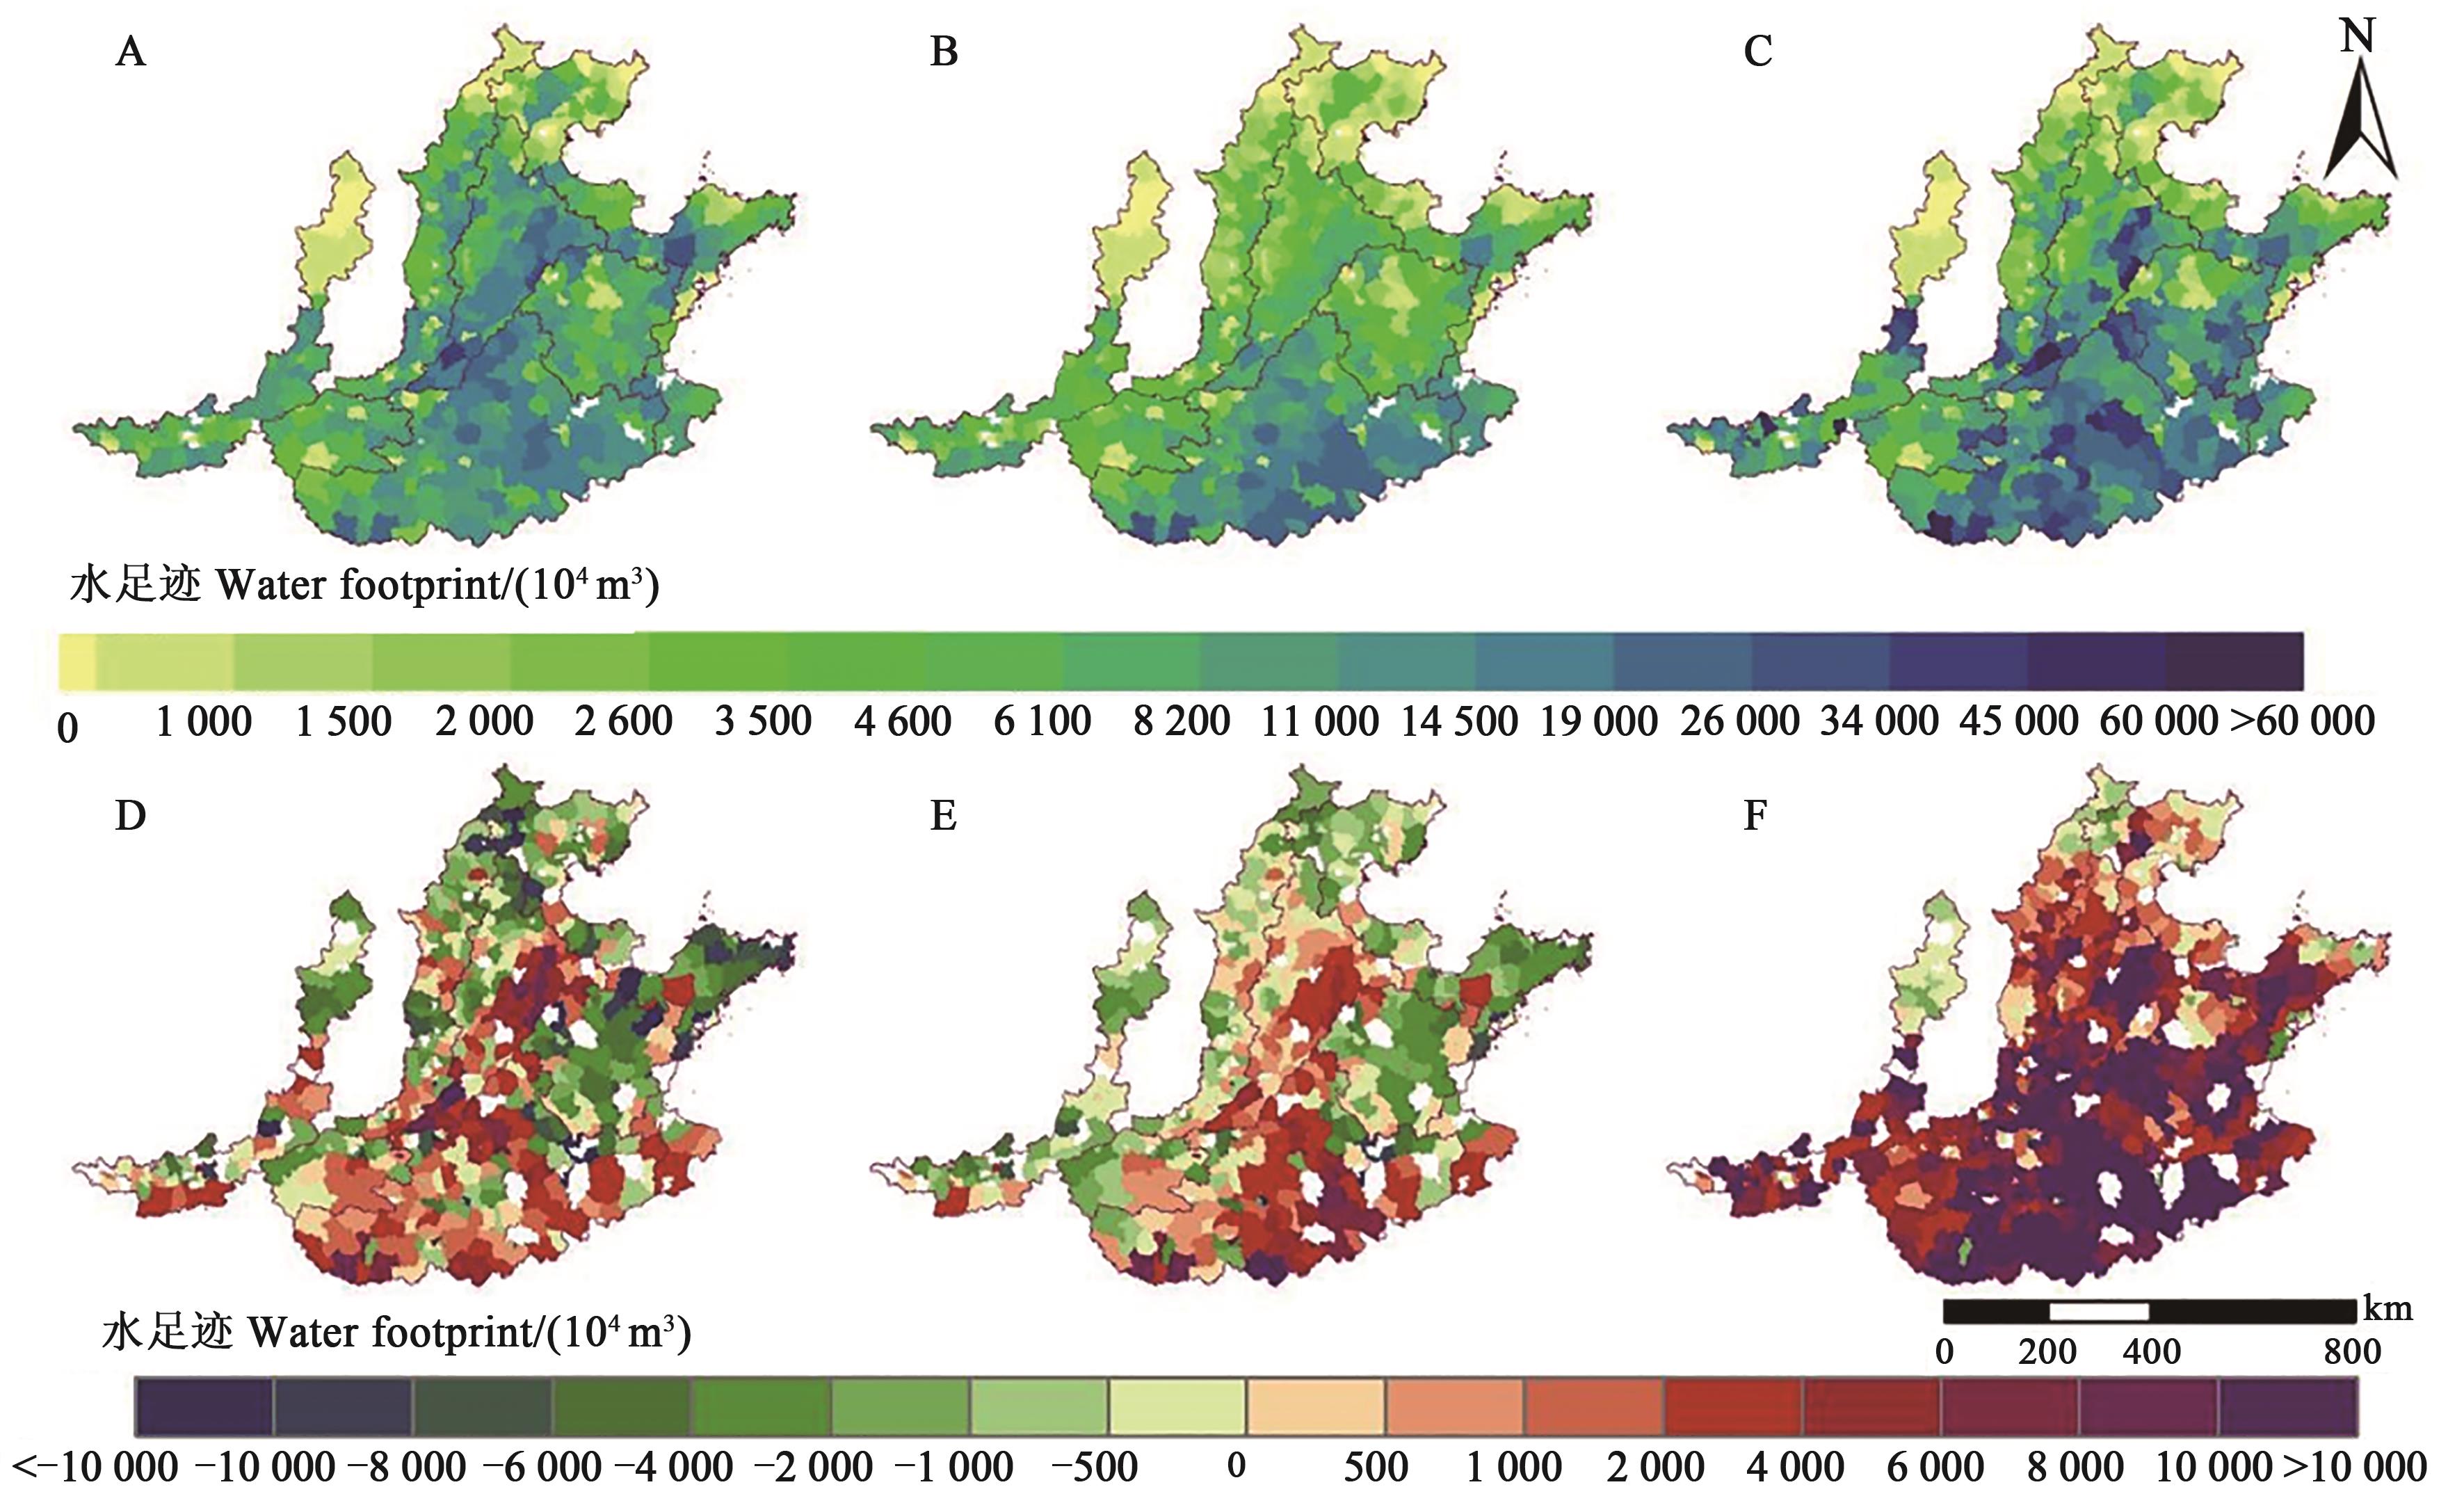
图2 冬小麦蓝、绿、灰水足迹2015年总量与1985—2015年变化量A:2015年蓝水足迹;B:2015年绿水足迹;C:2015年灰水足迹;D:1985—2015年蓝水足迹变化量;E:1985—2015年绿水足迹变化量;F:1985—2015年灰水足迹变化量
Fig. 2 Total amount in 2015 and variation from 1985 to 2015 of blue, green and gray water footprints of winter wheatA: Blue water footprint in 2015; B: Green water footprint in 2015; C: Grey water footprint in 2015; D: Changes in blue water footprint from 1985 to 2015; E: Changes in green water footprint from 1985 to 2015; F: Changes in grey water footprint from 1985 to 2015
亚区编号 Sub-zone code | 蓝水足迹 Blue water footprint/(104 m3) | 绿水足迹 Green water footprint/(104 m3) | 灰水足迹 Grey water footprint/(104 m3) |
|---|---|---|---|
| 2.1 | 424 230.53 | 256 960.89 | 373 544.22 |
| 2.2 | 538 229.67 | 211 788.56 | 473 800.56 |
| 2.3 | 913 641.54 | 344 867.87 | 898 188.38 |
| 2.4 | 341 141.11 | 195 592.40 | 450 639.62 |
| 2.5 | 1 298 791.10 | 1 343 188.32 | 2 086 842.38 |
| 2.6 | 129 818.33 | 93 650.51 | 182 135.14 |
| 2.7 | 307 456.90 | 192 372.33 | 628 510.32 |
表 2 2015年黄淮海农作区各亚区蓝、绿、灰水足迹量
Table 2 Blue, green and gray water footprints of sub-regions in Huang-Huai-Hai farming region in 2015
亚区编号 Sub-zone code | 蓝水足迹 Blue water footprint/(104 m3) | 绿水足迹 Green water footprint/(104 m3) | 灰水足迹 Grey water footprint/(104 m3) |
|---|---|---|---|
| 2.1 | 424 230.53 | 256 960.89 | 373 544.22 |
| 2.2 | 538 229.67 | 211 788.56 | 473 800.56 |
| 2.3 | 913 641.54 | 344 867.87 | 898 188.38 |
| 2.4 | 341 141.11 | 195 592.40 | 450 639.62 |
| 2.5 | 1 298 791.10 | 1 343 188.32 | 2 086 842.38 |
| 2.6 | 129 818.33 | 93 650.51 | 182 135.14 |
| 2.7 | 307 456.90 | 192 372.33 | 628 510.32 |
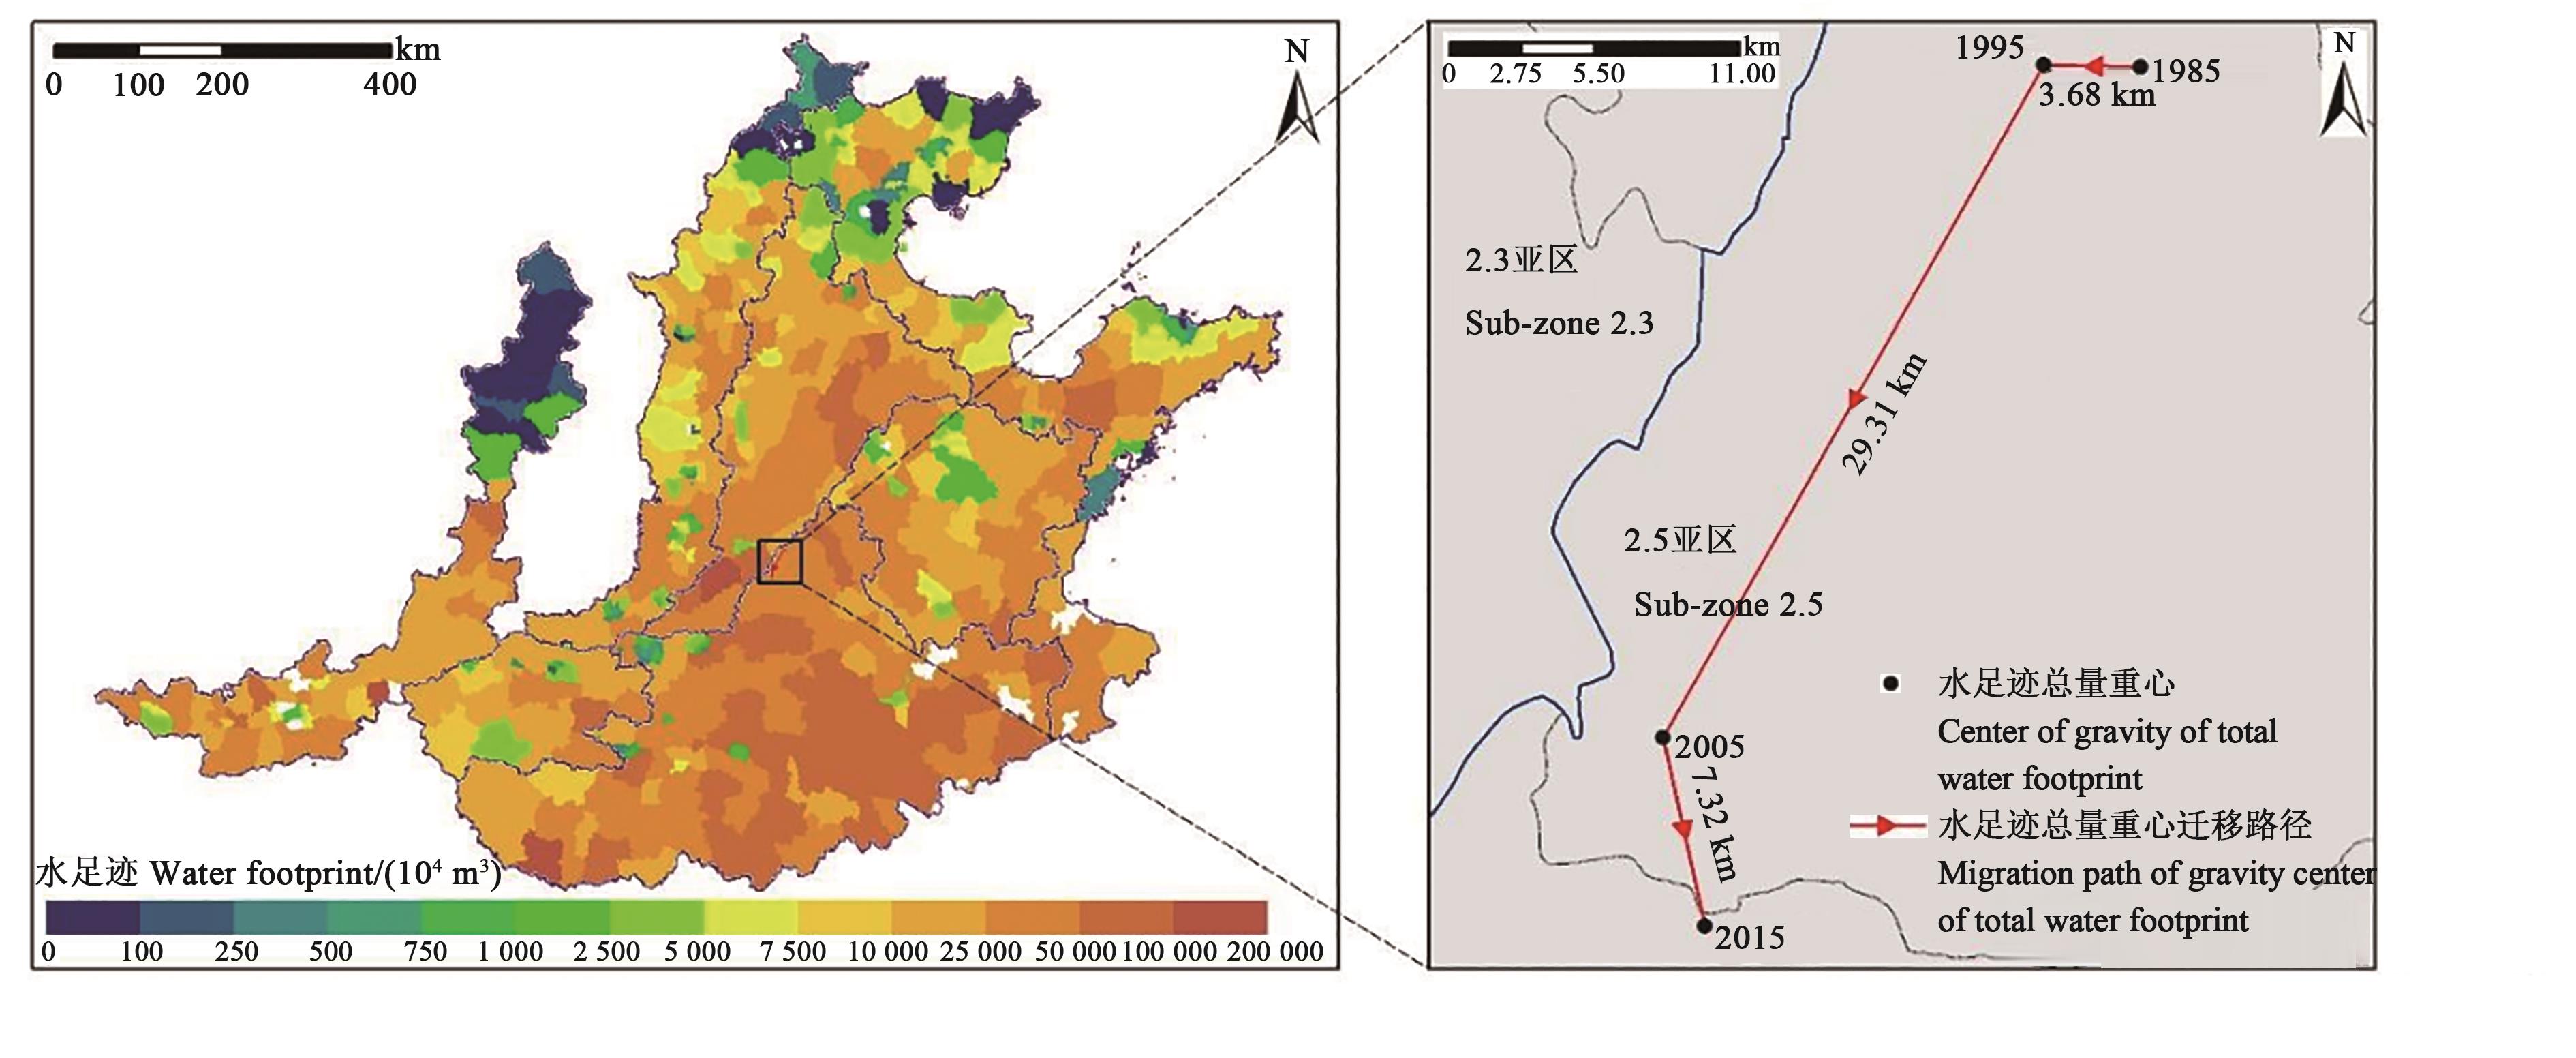
图3 2015年冬小麦水足迹总量与 1985—2015 年重心迁移
Fig. 3 Total amount in 2015 and the migration of gravity center from 1985 to 2015 of water footprint for winter wheat
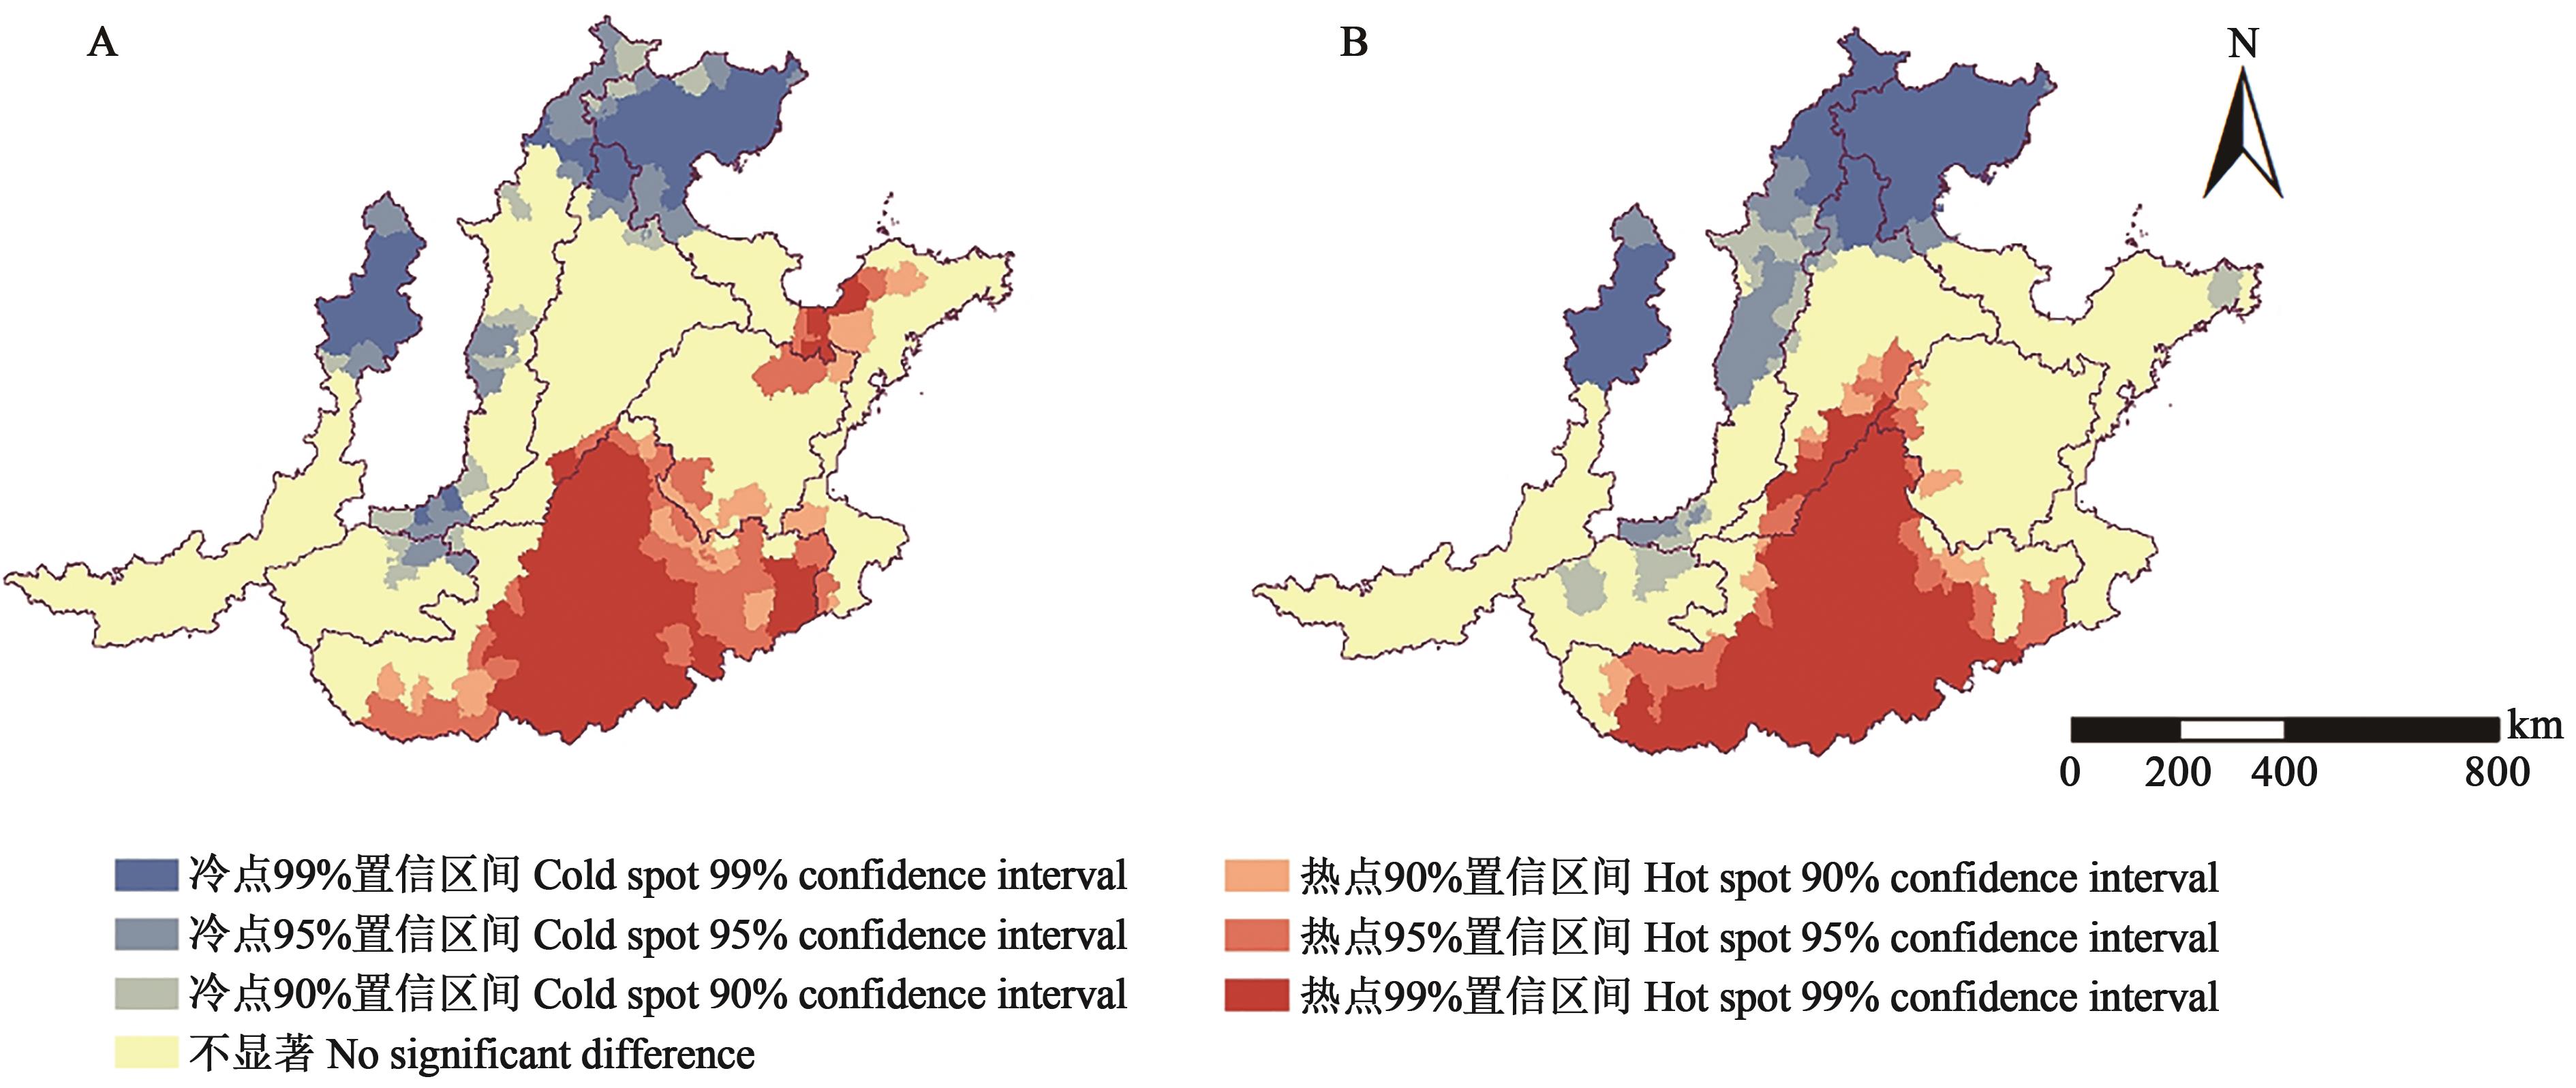
图4 1985—2015年黄淮海农作区冬小麦水足迹冷热点变化情况A:1985年冬小麦水足迹冷热点;B:2015年冬小麦水足迹冷热点
Fig. 4 Changes of cold and hot spots of water footprint for winter wheat in Huang-Huai-Hai farming region from 1985 to 2015A: Cold and hot spots of water footprint for winter wheat in 1985; B: Cold and hot spots of water footprint for winter wheat in 2015
| 1 | 张凡凡,张启楠,李福夺,等中国水足迹强度空间关联格局及影响因素分析 [J].自然资源学报,2019,34(5):934-944. |
| ZHANG F F, ZHANG Q N, LI F D, et al.. The spatial correlation pattern of water footprint intensity and its driving factors in China [J]. J. Nat. Resour., 2019, 34(5):934-944. | |
| 2 | 中华人民共和国水利部.2019年中国水资源公报[EB/OL].(2020-08-01)[2021-07-02]. . |
| 3 | 李瑞雪,余长明,倪九派,等.三峡库区农业非点源污染的思考[J].中国农学通报,2005(9):372-375. |
| LI R X, YU C M, YI J P, et al.. Insights into agricultural nonpoint source pollution in three gorges reservoir area [J]. Chin. Agric. Sci. Bull., 2005(9):372-375. | |
| 4 | 刘小刚,符娜,李闯,等.河南省主粮作物需水量变化趋势与成因分析[J].农业机械学报,2015,46(9):188-197. |
| LIU X G, FU N, LI C, et al.. Trends and causes analysis of water requirement for main grain crops in Henan Province [J]. Trans. Chin. Soc. Agric. Mach., 2015, 46(9):188-197. | |
| 5 | 郭相平,高爽,吴梦洋,等.中国农作物水足迹时空分布与影响因素分析[J].农业机械学报,2018,49(5):295-302. |
| GUO X P, GAO S, WU M Y, et al.. Analysis of temporal-spatial distribution and influencing factors of water footprint in crop production system of China [J]. Trans. Chin. Soc. Agric. Mach., 2018,49(5):295-302. | |
| 6 | HOEKSTRA A Y, HUNG P Q. Virtual water trade: a quantification of virtual water flows between nations in relation to international crop trade value of water research report series [R]. Netherlands, Delft: UNESCO-IHE Institute for Water Education, 2002. |
| 7 | MM M, HOEKSTRA A Y. National water footprint accounts: the green, blue and grey water footprint of production and consumption [R]. UNESCO-IHE Institute for Water Education, 2017. |
| 8 | GERBENS-LEENES W, HOEKSTRA A Y, MEER T H. The water footprint of bioenergy [J]. Proc. Natl. Acad. Sci. USA, 2009, 106(25):10219-10223. |
| 9 | 操信春,任杰,吴梦洋,等.基于水足迹的中国农业用水效果评价[J].农业工程学报,2018,34(5):1-8. |
| CAO X C, REN J, WU M Y, et al.. Assessing agricultural water use effect of China based on water footprint framework [J]. Trans. Chin. Soc. Agric. Eng., 2018, 34(5):1-8. | |
| 10 | 单纯宇,王素芬.海河流域作物水足迹研究[J].灌溉排水学报,2016,35(5):50-55. |
| SHAN C Y, WANG S F. Study on the crop water footprint in the Haihe River Basin [J]. J. Irrg. Drain., 2016, 35(5):50-55. | |
| 11 | 孙世坤,刘文艳,刘静,等.河套灌区春小麦生产水足迹影响因子敏感性及贡献率分析[J].中国农业科学,2016,49(14):2751-2762. |
| SUN S K, LIU W Y, LIU J, et al.. Sensitivity and contribution rate analysis of the influencing factors of spring wheat water footprint in Hrtao irrigation district [J]. Sci. Agric. Sin., 2016, 49(14):2751-2762. | |
| 12 | 卓拉,王伟,冯变变,等.黄河流域小麦生产水足迹量化与评价[J].农业机械学报,2019,50(9):264-271. |
| ZHUO L, WANG W, FENG B B, et al.. Water footprint accounting and evaluation for wheat production in Yellow River Basin [J]. Trans. Chin. Soc. Agric. Mach., 2019, 50(9):264-271. | |
| 13 | 冯东溥,魏晓妹,降亚楠.宝鸡峡灌区小麦水足迹时空变化特征与归因分析[J].农业机械学报,2017,48(12):269-277. |
| FENG D P, WEI X M, JIANG Y N. Temporal and spatial variation characteristics and attribution analysis of wheat water footprint in Baojixia irrigation area, China [J]. Trans. Chin. Soc. Agric. Mach., 2017, 48(12):269-277. | |
| 14 | 盖力强,谢高地,李士美,等.华北平原小麦、玉米作物生产水足迹的研究[J].资源科学,2010,32(11):2066-2071. |
| GE L Q, XIE G D, LI S M, et al.. A study on production water footprint of winter-wheat and maize in the North China Plain [J]. Resour. Sci., 2010, 32(11):2066-2071. | |
| 15 | 吴凯,许越先.黄淮海平原水资源开发的环境效应及其调控对策[J].地理学报,1997(2):20-28. |
| WU K, XU Y X. Environment effects and adjustment and control countermeasures of water resource utilization in the Huang-Huai-Hai plain [J]. Acta Geogr. Sin., 1997(2):20-28. | |
| 16 | 胡实,莫兴国,林忠辉.冬小麦种植区域的可能变化对黄淮海地区农业水资源盈亏的影响[J].地理研究,2017,36(5):861-871. |
| HU S, MO X G, LIN Z H. Impacts of possibility planting region change for winter wheat on agricultural water surplus and deficit in Huang-Huai-Hai region [J]. Geogr. Res., 2017, 36(5):861-871. | |
| 17 | 刘巽浩,陈阜.中国农作制[M].北京:中国农业出版社,2003:58-72. |
| LIU X H, CHEN F. Farming Systems in China [M]. Beijing:China Agricultural University Press,2003:58-72. | |
| 18 | 中国气象局大气探测技术中心,国家气象信息中心,湖北省气象局. 地面气象观测规范第21部分:缺测记录的处理和不完整记录的统计: [S].北京:气象出版社,2007. |
| 19 | 国家气象信息中心. 地面气象观测资料质量控制: [S].北京:气象出版社,2010. |
| 20 | 农业部市场与经济信息司.中国县(市)农业统计资料2008[R].北京:农业部市场与经济信息司,2009. |
| 21 | 国家发展改革委价格司.建国以来全国主要农产品成本收益资料汇编1953~1997[M].北京:中国物价出版社,2003. |
| 22 | 国家发展和改革委员会价格司.全国农产品成本收益资料汇编[R].北京:中国统计出版社,2002-2017. |
| 23 | 任天志,刘宏斌,范先鹏,等.全国农田面源污染排放系数手册[M].北京:中国农业出版社,2015:30-85. |
| 24 | 国家环境保护总局. 地表水环境质量标准: [S].北京:中国标准出版社,2002. |
| 25 | 刘珍环,李正国,唐鹏钦,等.近30年中国水稻种植区域与产量时空变化分析[J].地理学报,2013,68(5):680-693. |
| LIU Z H, LI Z G, TANG P Q, et al.. Change analysis of rice area and production in China during the past three decades [J]. Acta Geogr. Sin., 2013, 68(5):680-693. | |
| 26 | GETIS A, ORD J K. The analysis of spatial association by use of distance statistics [J]. Geogr. Anal., 1992, 24(3):189-206. |
| 27 | ORD J K, GETIS A. Local spatial autocorrelation statistics: distributional issues and an application [J]. Geogr. Anal., 1995, 27(4):286-306. |
| 28 | 王恩利,韩湘玲.黄淮海地区冬小麦、夏玉米生产力评价及其应用[J].中国农业气象,1990(2):41-46. |
| WANG E L, HAN X L. Productivity evaluation and application of winter wheat and summer maize in Huang-Huai-Hai region [J]. Chin. J. Agron., 1990(2):41-46. | |
| 29 | 黄珂,刘忠,杨丽芳.基于多年MODIS-NDVI的黄淮海农区冬小麦生产力评价[J].农业工程学报,2014,30(2):153-161. |
| HUANG K, LIU Z, YANG L F. Evaluation of winter wheat productivity in Huang-Huai-Hai region by multiyear graded MODIS-NDVI [J]. Trans. Chin. Soc. Agric. Eng., 2014, 30(2):153-161. | |
| 30 | FAO. Environmental considerations in irrigation development. Irrigation potential in Africa: a basin approach [R]// FAO Land and Water Bulletin 4. Rome, Italy: Food and Agriculture Organization, 1997. |
| 31 | 冯兴兴,王学凤,阳辉,等.辽宁省春玉米生产水足迹的时空变化研究[J].中国水利水电科学研究院学报,2020,18(6):447-454. |
| FENG X X, WANG X F, YANG H, et al.. Temporal and spatial changes of water footprint in spring corn production in Liaoning province [J]. J. China Inst. Water Resour. Hydrop. Res., 2020,18(6):447-454. | |
| 32 | ALBERSEN P J, HOUBA H E D, KEYZER M A. Pricing a raindrop in apro- cess-based model: general methodology and a case study of the Upper-Zambezi [J]. Phys. Chem. Earth, 2003(28):183-192. |
| 33 | HOEKSTRA A Y, SAVENJIE H H G, CHAPAGIAN A K. An integratedap-proach towards assessing the value of water: a case study on the Zambezi basin [J]. Integr. Assess., 2001(2):199-208. |
| 34 | 杨瑞珍,肖碧林,陈印军,等.降水资源的高效利用-沧州市农业持续发展的战略选择[J].中国农业资源与区划,2009,30(5):50-53. |
| YANG R Z, XIAO B L, CHEN Y J, et al.. Utilization of rainfall resources with high efficiency selection of sustainable agricultural development strategy in Cangzhou city [J]. Chin. J. Agric. Res. Reg. Planning, 2009, 30(5):50-53. | |
| 35 | 白冰.近30年我国小麦生产时空变化特征及其产量贡献率分析[D].北京:中国农业大学,2018. |
| BAI B.The Analysis of spatial-temporal changes of wheat production and contributing rate of wheat output during past three decades in China [D]. Beijing: China Agricultural University, 2018. | |
| 36 | 王旭,李贞宇,马文奇,等.中国主要生态区小麦施肥增产效应分析[J].中国农业科学,2010,43(12):2469-2476. |
| WANG X, LI Z Y, MA W Q, et al.. Effects of fertilization on yield increase of wheat in different agro-ecological regions of China [J]. Sci. Agric. Sin., 2010, 43(12):2469-2476. | |
| 37 | RUTTAN V W.The transition to agricultural sustainability [J]. Proc. Natl. Acad. Sci. USA, 1999, 96(11):5960-5967. |
| 38 | 谭亚军,李少南,孙利.农药对水生态环境的影响[J].农药,2003,42(12):12-14. |
| TAN Y J, LI S N, SUN L. The pollution of pesticides to the water environment [J]. Agrochemicals, 2003, 42(12):12-14. | |
| 39 | LIU X J, ZHANG Y, HAN W X, et al..Enhanced nitrogen deposition over China [J]. Nature, 2013,4 94(7438):459-463. |
| 40 | 杨晓琳,宋振伟,王宏,等.黄淮海农作区冬小麦需水量时空变化特征及气候影响因素分析[J].中国生态农业学报,2012,20(3):356-362. |
| YANG X L, SONG Z W, WANG H, et al.. Spatio-temporal variations of winter wheat water requirement and climatic causes in Huang-Huai-Hai farming region [J]. Chin. J. Eco-Agric., 2012, 20(03):356-362. | |
| 41 | 马洁华,刘园,杨晓光,等.全球气候变化背景下华北平原气候资源变化趋势[J].生态学报,2010,30(14):3818-3827. |
| MA J H, LIU Y, YANG X G, et al.. Characteristics of climate resources under global climate change in the North China plain [J]. Acta Ecol. Sin., 2010, 30(14):3818-3827. | |
| 42 | 杨晓琳,黄晶,陈阜,等.黄淮海农作区玉米需水量时空变化特征比较研究[J].中国农业大学学报,2011,16(5):26-31. |
| YANG X L, HUANG J, CHEN F, et al.. Comparison of temporal and spatial variation of water requirements of corn in Huang-Huai-Hai farming system region [J]. J. China Agric. Univ., 2011, 16(5):26-31. |
| [1] | 赵文昊, 姬江涛, 马淏, 金鑫, 李雪, 马海港. 基于改进K-means算法的冬小麦覆盖度提取研究[J]. 中国农业科技导报, 2023, 25(1): 83-91. |
| [2] | 刘雪静, 鲍晓远, 候晓阳, 甄文超. 海河平原春季限水灌溉下冬小麦农田水分动态及产量形成特征[J]. 中国农业科技导报, 2022, 24(7): 167-176. |
| [3] | 陈昱利, 杨平, 李华伟. 种植密度和播期对冬小麦籽粒品质影响的模拟研究[J]. 中国农业科技导报, 2022, 24(10): 143-153. |
| [4] | 杨亮彦, 黎雅楠, 范鸿建, 王雅婷. 毛乌素沙地蒸散发时空分布及影响因素分析[J]. 中国农业科技导报, 2022, 24(10): 169-178. |
| [5] | 王健, 许爱玲, 卫晓东, 席吉龙, 杨娜, 王珂, 席天元, 张建诚. 运城盆地不同播期小麦春季冻害风险评价[J]. 中国农业科技导报, 2022, 24(1): 137-147. |
| [6] | 郭佳晖, 白雄辉, 王爱东, 李瑞杰, 石晓鑫, 史勇峰, 李爱莲, 王西成, 王宏富, 郭杰. 黄淮北片冬麦区国家区试冬小麦品种抗寒性鉴定与评价[J]. 中国农业科技导报, 2021, 23(10): 25-34. |
| [7] | 张胜男1,聂兆君1*,赵鹏1,李金峰1,李永革2,刘红恩1*,秦晓明1,秦世玉1. 磷硫配施对冬小麦硒吸收及转运的影响[J]. 中国农业科技导报, 2020, 22(5): 137-144. |
| [8] | 尹焕丽1,岳艳军2,常凤1,王海标1,苗玉红1,王宜伦1*. 新型尿素对冬小麦产量及氮素吸收利用的影响[J]. 中国农业科技导报, 2020, 22(5): 145-152. |
| [9] | 李华伟1,陈昱利2,禚其翠1,张宾1*. 施氮对冬小麦生长及产量影响的模拟研究[J]. 中国农业科技导报, 2019, 21(12): 119-127. |
| [10] | 程婉莹1,王春艳1*,任徳超2,崔三荣1,耿金剑1. 不同穗分化时期冬小麦形态抗冻性评价[J]. 中国农业科技导报, 2018, 20(7): 83-90. |
| [11] | 刘洪润1,高雪纯1,彭艳新1,赵阳佳1,李润枝1*,宋振伟2*. 近55年来河西走廊农业水热资源变化特征与趋势[J]. 中国农业科技导报, 2018, 20(1): 85-94. |
| [12] | 李书钦1,2,诸叶平2*,刘海龙2,李世娟2,刘升平2. 冬小麦返青后叶片高度模型构建及三维可视化[J]. 中国农业科技导报, 2017, 19(11): 59-67. |
| [13] | 吴越,黄洪亮*,刘健,杨嘉樑,齐广瑞,饶欣,李灵智. 西北太平洋公海秋刀鱼CPUE的时空分布研究[J]. 中国农业科技导报, 2016, 18(6): 146-152. |
| [14] | 杨敏1,刘峻明1*,王鹏新1,胡新2,黄健熙1,汪念1. 基于MODIS大气廓线产品分析晚霜冻对冬小麦产量的影响[J]. 中国农业科技导报, 2016, 18(2): 78-85. |
| [15] | 胡乔玲1,刘峻明1*,王春艳2,王鹏新1,黄健熙1. 冬小麦拔节期遥感监测方法研究[J]. , 2013, 15(6): 152-157. |
| 阅读次数 | ||||||||||||||||||||||||||||||||||||||||||||||||||
|
全文 53
|
|
|||||||||||||||||||||||||||||||||||||||||||||||||
|
摘要 183
|
|
|||||||||||||||||||||||||||||||||||||||||||||||||
 京公网安备11010802021197号