


中国农业科技导报 ›› 2022, Vol. 24 ›› Issue (11): 112-120.DOI: 10.13304/j.nykjdb.2021.0918
• 智慧农业 农机装备 • 上一篇
张静1( ), 郭思梦1, 韩迎春2, 雷亚平2, 邢芳芳2, 杜文丽2, 李亚兵1,2(), 冯璐1,2()
收稿日期:2021-10-28
接受日期:2022-04-12
出版日期:2022-11-15
发布日期:2022-11-29
通讯作者:
李亚兵,冯璐
作者简介:张静 E-mail:15139815006@163.com
基金资助:
Jing ZHANG1(), Simeng GUO1, Yingchun HAN2, Yaping LEI2, Fangfang XING2, Wenli DU2, Yabing LI1,2(), Lu FENG1,2()
Received:2021-10-28
Accepted:2022-04-12
Online:2022-11-15
Published:2022-11-29
Contact:
Yabing LI,Lu FENG
摘要:
目前,无人机系统已应用于作物产量估算,利用无人机搭载的RGB相机在花铃期和吐絮期从3个高度(10、20和30 m)分别采集棉花冠层图像,提取图像的颜色指数和纹理特征,进而对提取的特征分别进行逐步回归分析和因子分析,筛选出重要特征并构建棉花产量估算模型。通过对比分析2个生育时期和3个高度的产量估算模型,最终确定利用RGB图像对棉花进行产量估算的最佳生育时期和最佳高度。结果表明, 20 和30 m高度下花铃期图像建立的产量模型拟合度以及模型精度均比吐絮期好,而40 m高度下2个生育时期的模型拟合度接近,但花铃期的验证结果不显著;对比20和30 m高度下花铃期以及40 m高度下吐絮期的产量估算模型发现,30 m高度下花铃期通过SWR方法建立的模型拟合效果最佳,由此表明,棉花产量估算的最佳生育时期为花铃期,图像采集的最佳高度为30 m。综上,利用无人机RGB图像能准确快速估算棉花产量,为基于可见光图像的棉花产量估算提供了理论和技术参考,并为其他农作物估产模型的建立提供借鉴。
中图分类号:
张静, 郭思梦, 韩迎春, 雷亚平, 邢芳芳, 杜文丽, 李亚兵, 冯璐. 基于无人机RGB图像的棉花产量估算[J]. 中国农业科技导报, 2022, 24(11): 112-120.
Jing ZHANG, Simeng GUO, Yingchun HAN, Yaping LEI, Fangfang XING, Wenli DU, Yabing LI, Lu FENG. Estimation of Cotton Yield Based on Unmanned Aerial Vehicle RGB Images[J]. Journal of Agricultural Science and Technology, 2022, 24(11): 112-120.
生育时期 Growth stage | 20 m | 30 m | 40 m | |||
|---|---|---|---|---|---|---|
| 因子 Factor | 符号 Symbol | 因子 Factor | 符号 Symbol | 因子 Factor | 符号 Symbol | |
花铃期 Flowering and boll stage | WI 方向度 Directionality | W D | WI ENT | W E | IDM | M |
吐絮期 Boll-opening stage | IKAW 方向度 Directionality | I D | WI | W | 粗糙度 Coarseness | C |
表1 逐步回归分析结果
Table 1 Results of stepwise regression analysis
生育时期 Growth stage | 20 m | 30 m | 40 m | |||
|---|---|---|---|---|---|---|
| 因子 Factor | 符号 Symbol | 因子 Factor | 符号 Symbol | 因子 Factor | 符号 Symbol | |
花铃期 Flowering and boll stage | WI 方向度 Directionality | W D | WI ENT | W E | IDM | M |
吐絮期 Boll-opening stage | IKAW 方向度 Directionality | I D | WI | W | 粗糙度 Coarseness | C |
| 生育时期 Growth stage | 因子Factor | 20 m | 30 m | 40 m |
|---|---|---|---|---|
花铃期 Flowering and boll stage | FA1 | -271.4 | 235.7 | -180.7 |
| FA2 | -139.2 | -197.1 | -39.1 | |
| FA3 | 27.9 | -69.2 | 158.8 | |
吐絮期 Boll-opening stage | FA1 | 224.8 | 204.5 | 160.7 |
| FA2 | -112.3 | -110.0 | 63.5 | |
| FA3 | 104.3 | 100.5 | 165.2 |
表2 因子分析结果
Table 2 Results of factor analysis
| 生育时期 Growth stage | 因子Factor | 20 m | 30 m | 40 m |
|---|---|---|---|---|
花铃期 Flowering and boll stage | FA1 | -271.4 | 235.7 | -180.7 |
| FA2 | -139.2 | -197.1 | -39.1 | |
| FA3 | 27.9 | -69.2 | 158.8 | |
吐絮期 Boll-opening stage | FA1 | 224.8 | 204.5 | 160.7 |
| FA2 | -112.3 | -110.0 | 63.5 | |
| FA3 | 104.3 | 100.5 | 165.2 |
| 高度 Height/m | 生育时期 Growth stage | 分析方法 Analysis method | 拟合模型 Fitting model | 决定 系数R2 | RMSE/(kg·hm-2) | NRMSE/% |
|---|---|---|---|---|---|---|
| 20 | 花铃期 Flowering and boll stage | 逐步回归SWR | Y=-3 598W+0.886 8D-1 250 | 0.733 3 | 184.4 | 5.71 |
| 因子分析FN | Y=-271.4FA1-139.2FA2+27.89FA3+3 228 | 0.735 8 | 183.5 | 5.68 | ||
吐絮期 Boll-opening stage | 逐步回归SWR | Y=18 792I+1.952D+2 260 | 0.606 5 | 224.0 | 6.94 | |
| 因子分析FN | Y=224.8FA1-112.3FA2+104.3FA3+3 252 | 0.592 6 | 230.6 | 7.14 | ||
| 30 | 花铃期 Flowering and boll stage | 逐步回归SWR | Y=-3 085W-3 102E+15 016 | 0.784 9 | 165.6 | 5.13 |
| 因子分析FN | Y=235.2FA1-134.1FA2-152.6FA3+3 228 | 0.757 4 | 175.9 | 5.45 | ||
吐絮期 Boll-opening stage | 逐步回归SWR | Y=-296 8W+1 030 | 0.415 9 | 272.9 | 8.45 | |
| FN | Y=204.5FA1-110FA2+100.5FA3 | 0.502 0 | 252.0 | 7.81 | ||
| 40 | 花铃期 Flowering and boll stage | 逐步回归SWR | Y=-238 87M+11 146 | 0.435 5 | 268.3 | 8.31 |
| 因子分析FN | Y=-180.7FA1-39.06FA2+158.8FA3+3 228 | 0.465 6 | 261.0 | 8.09 | ||
吐絮期 Boll-opening stage | 逐步回归SWR | Y=-2 369C+19 032 | 0.506 0 | 251.0 | 7.78 | |
| 因子分析FN | Y=160.7FA1+63.53FA2+165.2FA3 | 0.448 1 | 265.3 | 8.22 |
表3 不同产量模型对比分析
Table 3 Comparative analysis of different yield models
| 高度 Height/m | 生育时期 Growth stage | 分析方法 Analysis method | 拟合模型 Fitting model | 决定 系数R2 | RMSE/(kg·hm-2) | NRMSE/% |
|---|---|---|---|---|---|---|
| 20 | 花铃期 Flowering and boll stage | 逐步回归SWR | Y=-3 598W+0.886 8D-1 250 | 0.733 3 | 184.4 | 5.71 |
| 因子分析FN | Y=-271.4FA1-139.2FA2+27.89FA3+3 228 | 0.735 8 | 183.5 | 5.68 | ||
吐絮期 Boll-opening stage | 逐步回归SWR | Y=18 792I+1.952D+2 260 | 0.606 5 | 224.0 | 6.94 | |
| 因子分析FN | Y=224.8FA1-112.3FA2+104.3FA3+3 252 | 0.592 6 | 230.6 | 7.14 | ||
| 30 | 花铃期 Flowering and boll stage | 逐步回归SWR | Y=-3 085W-3 102E+15 016 | 0.784 9 | 165.6 | 5.13 |
| 因子分析FN | Y=235.2FA1-134.1FA2-152.6FA3+3 228 | 0.757 4 | 175.9 | 5.45 | ||
吐絮期 Boll-opening stage | 逐步回归SWR | Y=-296 8W+1 030 | 0.415 9 | 272.9 | 8.45 | |
| FN | Y=204.5FA1-110FA2+100.5FA3 | 0.502 0 | 252.0 | 7.81 | ||
| 40 | 花铃期 Flowering and boll stage | 逐步回归SWR | Y=-238 87M+11 146 | 0.435 5 | 268.3 | 8.31 |
| 因子分析FN | Y=-180.7FA1-39.06FA2+158.8FA3+3 228 | 0.465 6 | 261.0 | 8.09 | ||
吐絮期 Boll-opening stage | 逐步回归SWR | Y=-2 369C+19 032 | 0.506 0 | 251.0 | 7.78 | |
| 因子分析FN | Y=160.7FA1+63.53FA2+165.2FA3 | 0.448 1 | 265.3 | 8.22 |

图1 高度20 m花铃期和吐絮期产量估算模型验证结果A:花铃期-逐步回归;B:花铃期-因子分析;C:吐絮期-逐步回归;D:吐絮期-因子分析
Fig. 1 Verification results of flowering and boll development stage and boll-opening stage yield estimation model at the height of 20 mA:Flowing and boll stage-SWR;B:Flowing and boll stage-FN;C:Boll-opening stage-SWR;D:Boll-opening stage-FN
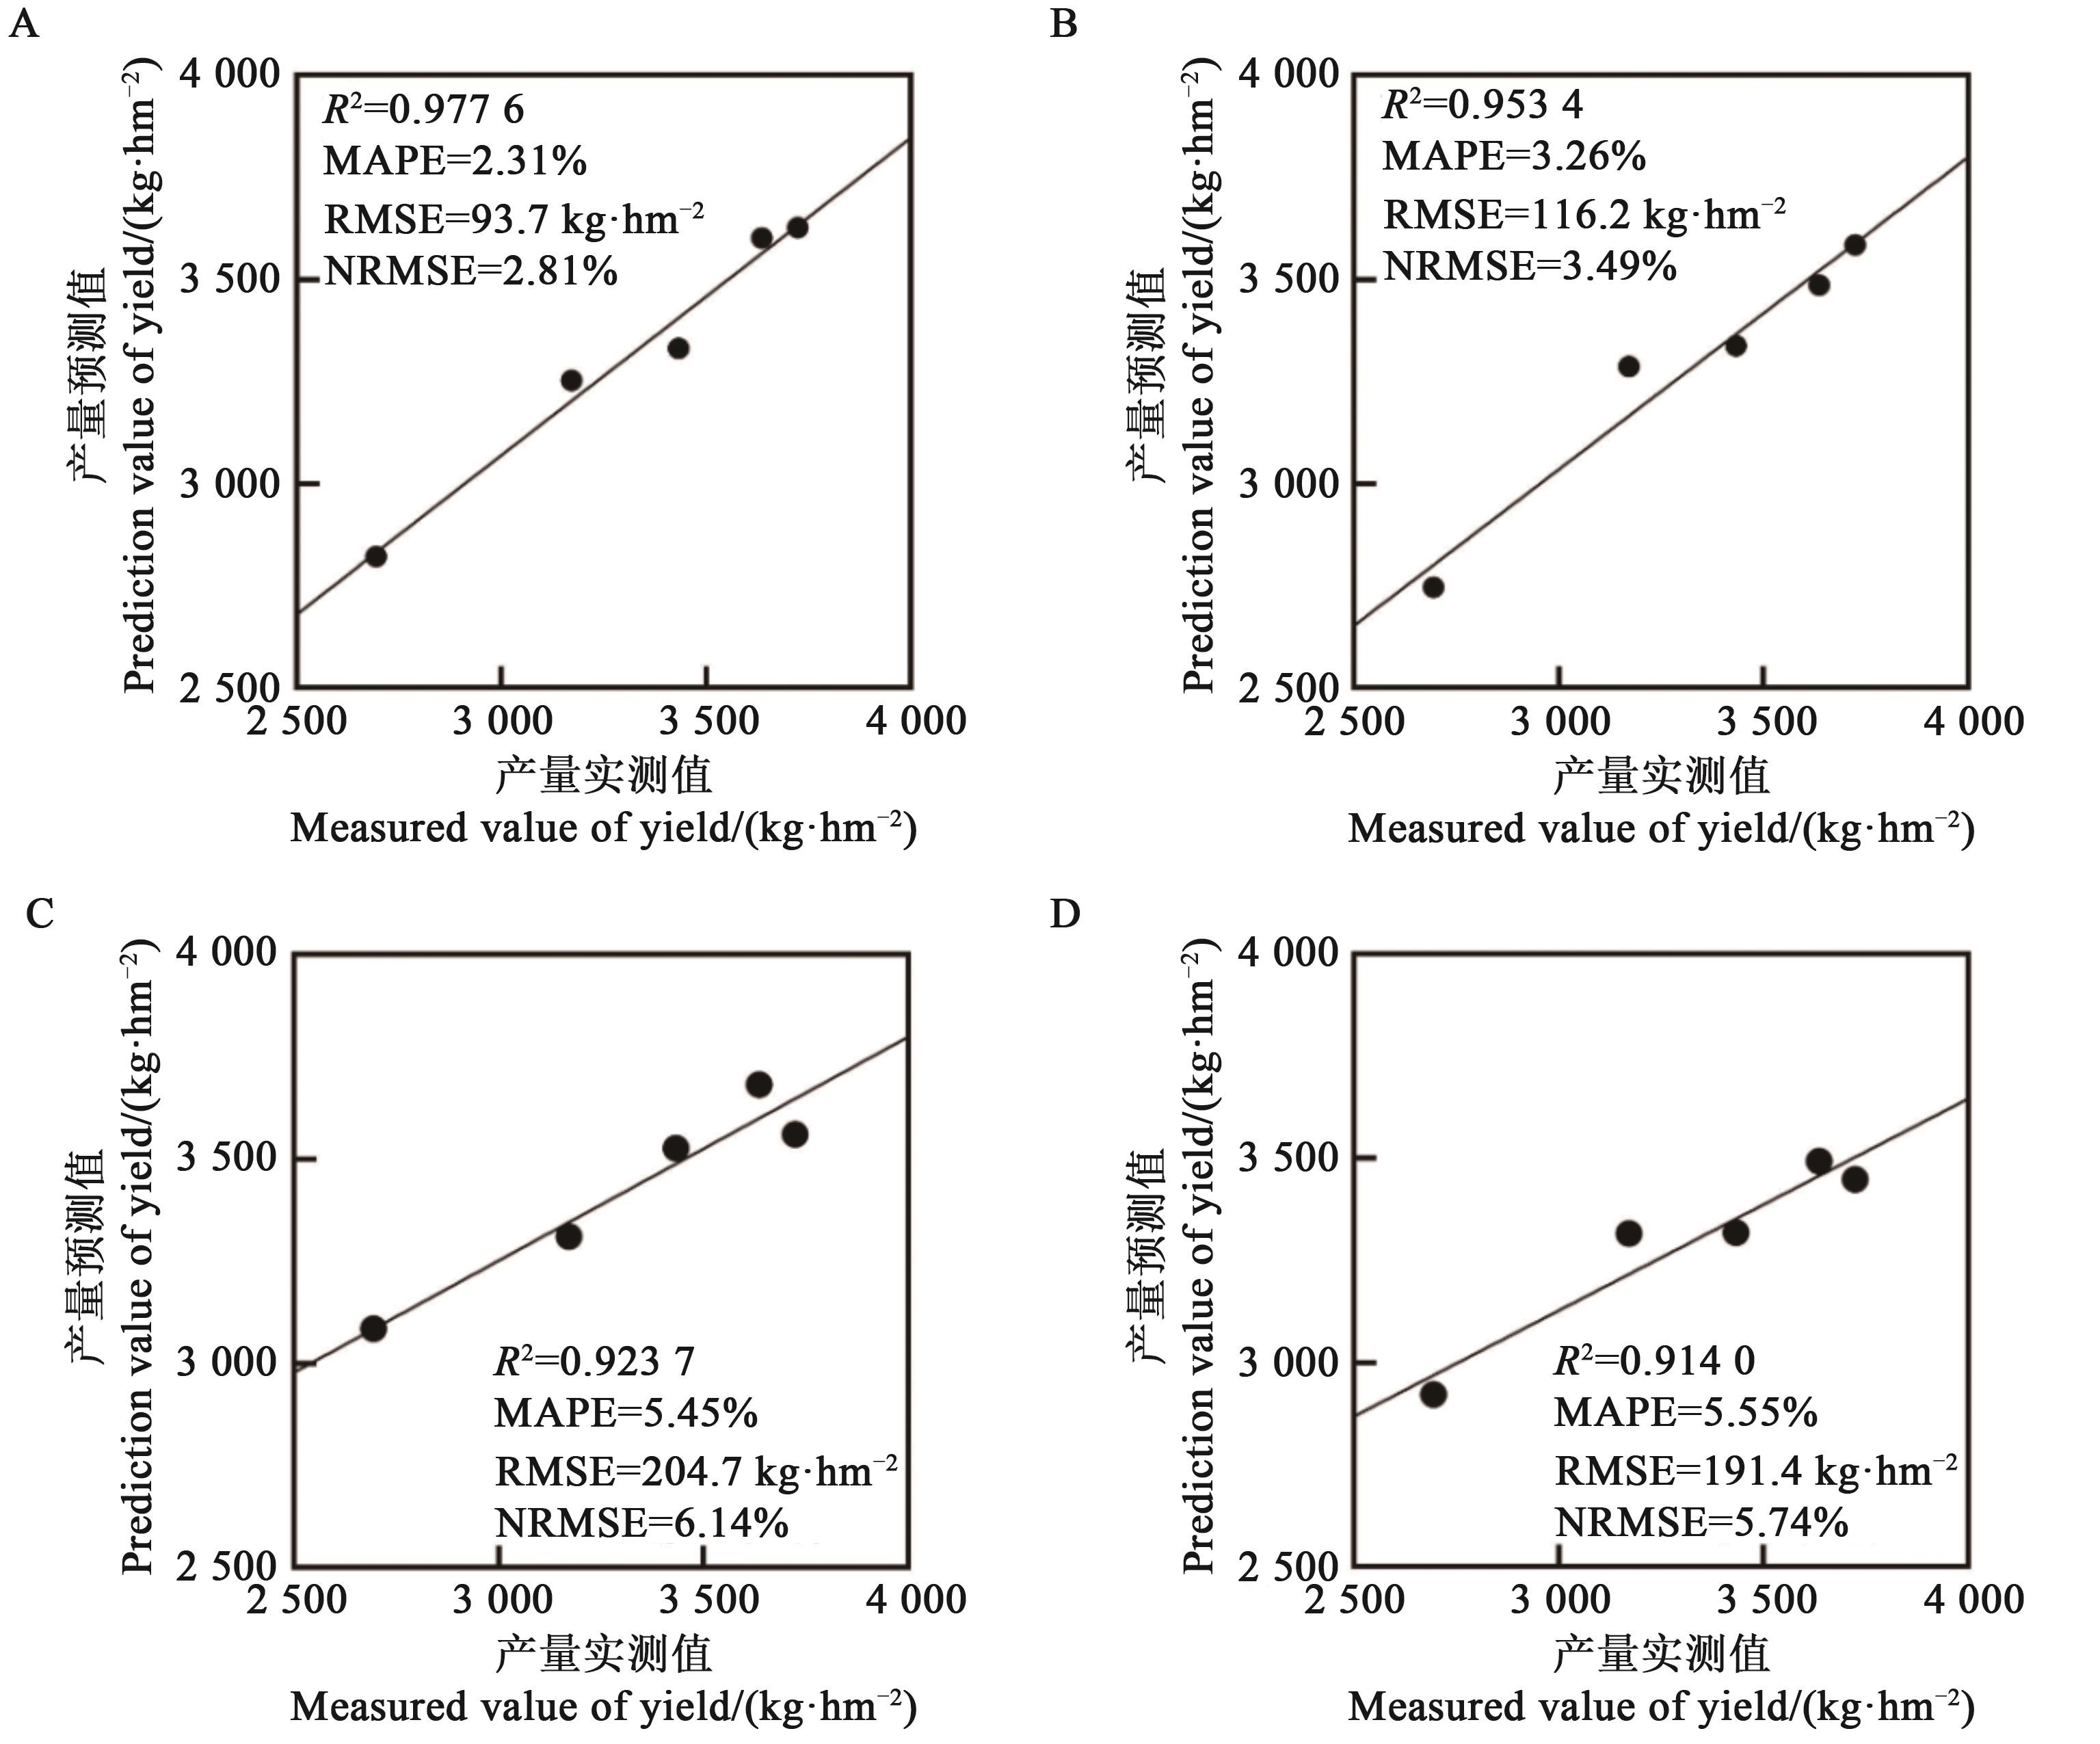
图2 高度30 m花铃期和吐絮期产量估算模型验证结果A:花铃期-逐步回归;B:花铃期-因子分析;C:吐絮期-逐步回归;D:吐絮期-因子分析
Fig. 2 Verification results of flowering and boll development stage and boll-opening stage yield estimation model at the height of 30 mA:Flowing and boll stage-SWR;B:Flowing and boll stage-FN;C:Boll-opening stage-SWR;D:Boll-opening stage-FN
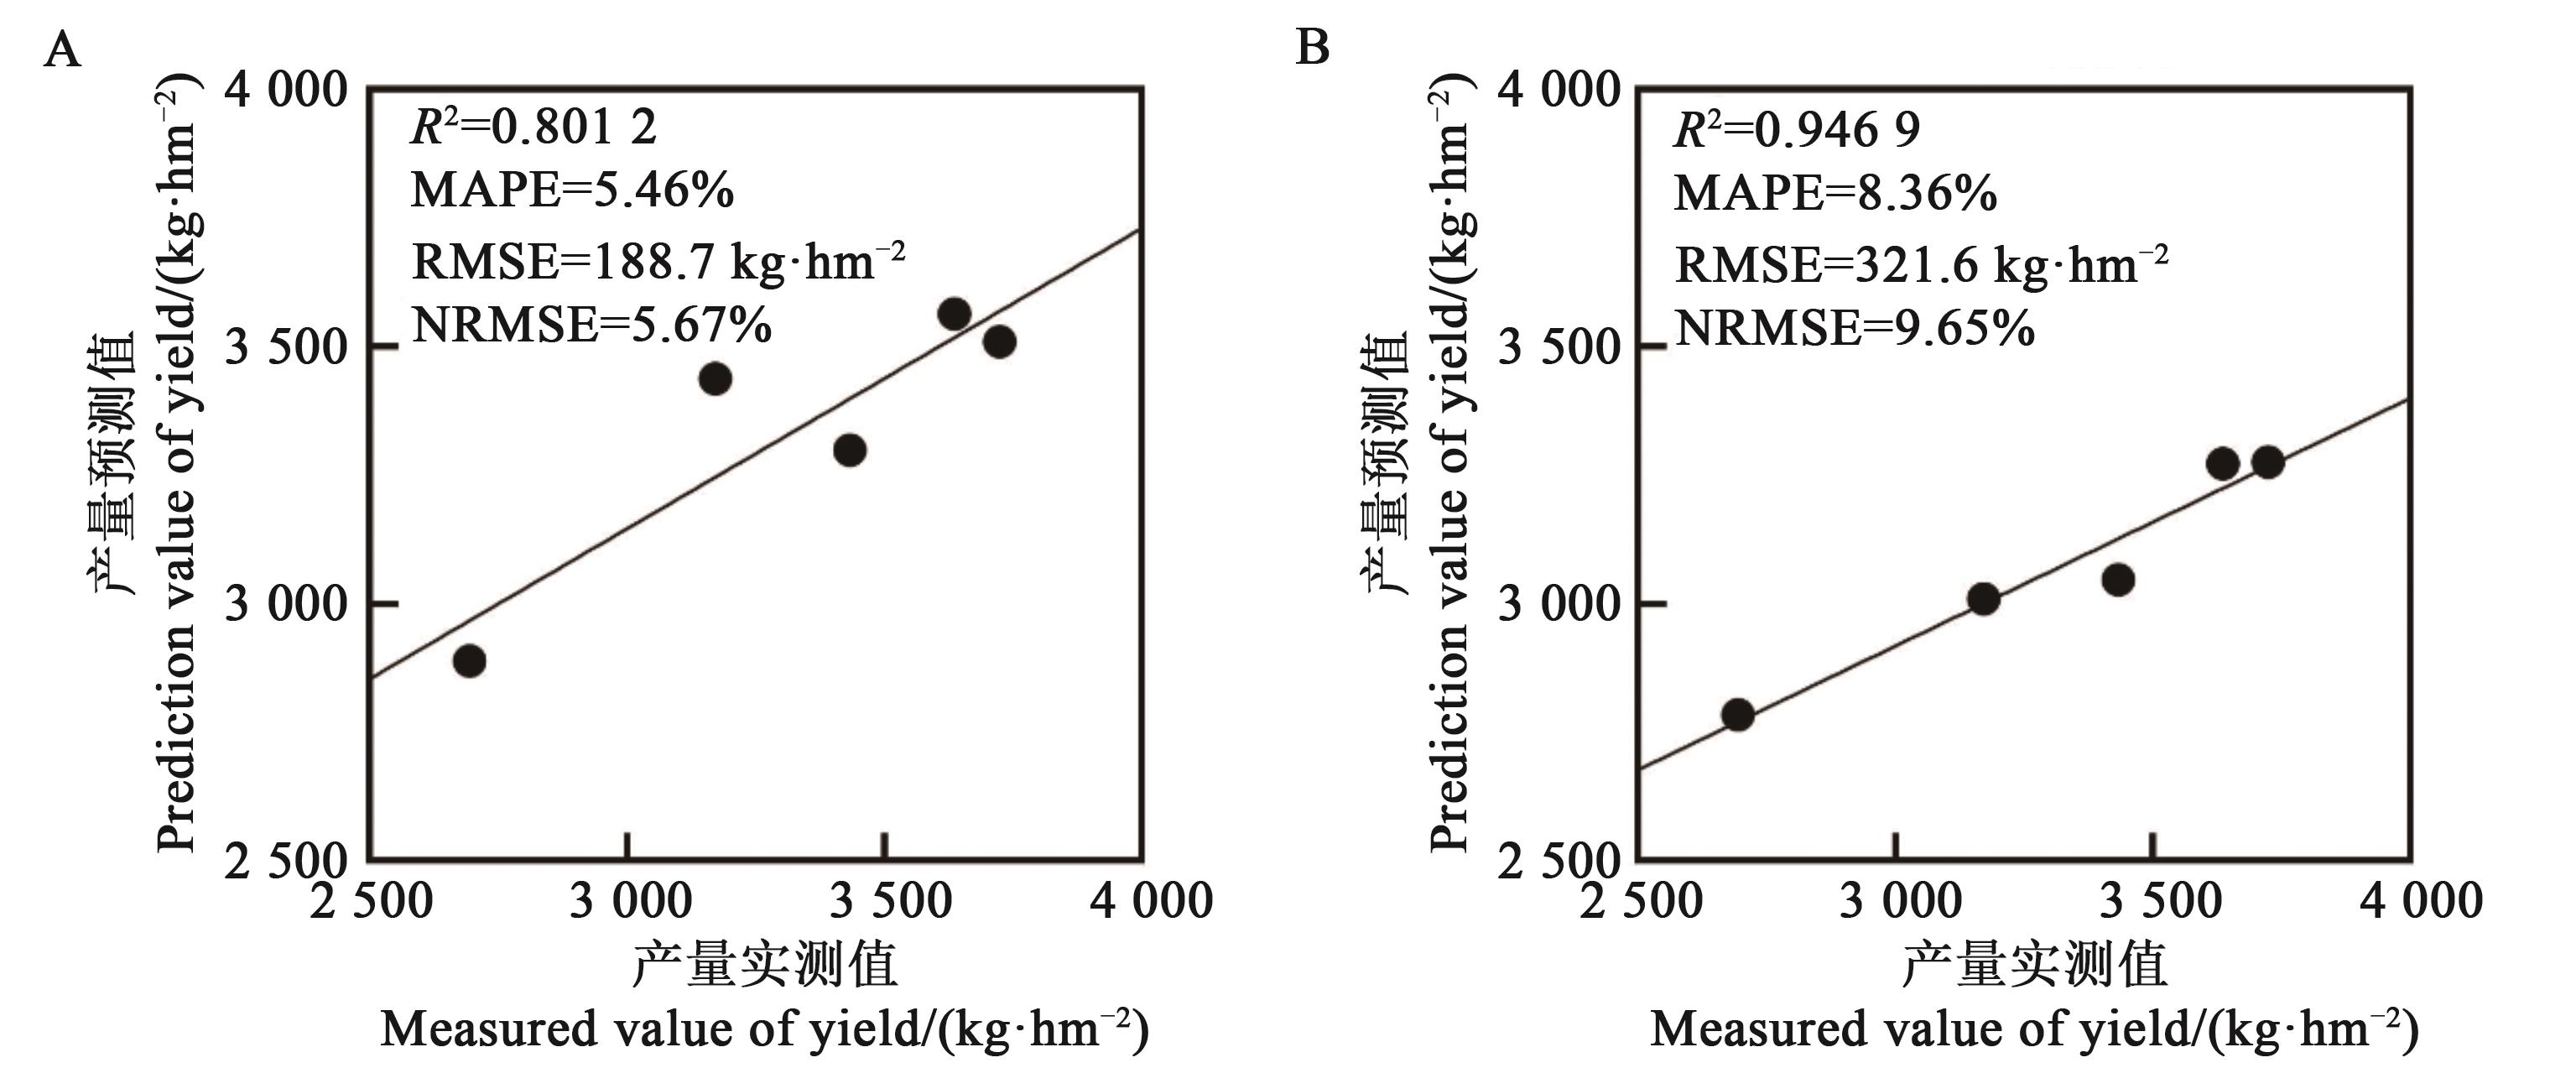
图3 高度40 m吐絮期产量估算模型验证结果A:吐絮期-逐步回归;B:吐絮期-因子分析
Fig. 3 Verification results of boll-opening stage yield estimation model at the height of 40 mA:Boll-opening stage-SWR;B:Boll-opening stage-FN
| 1 | 张美娜,冯爱晶,周建峰,等.基于无人机采集的视觉与光谱图像预测棉花产量[J].农业工程学报,2019,35(5):91-98. |
| ZHANG M N, FENG A J, ZHOU J F, et al.. Cotton yield prediction using remote visual and spectral images captured by UAV system [J]. Trans. Chin. Soc. Agric. Eng., 2019,35(5):91-98. | |
| 2 | XU W, LAN Y, LI Y, et al.. Classification method of cultivated land based on UAV visible light remote sensing [J]. Int. J. Agric. Biol. Eng., 2019, 12(3): 103-109. |
| 3 | XU W, CHEN P, ZHAN Y, et al.. Cotton yield estimation model based on machine learning using time series UAV remote sensing data [J/OL]. Int. J. Appl. Earth Obs., 2021, 104: 102511[2021-10-27]. . |
| 4 | COLOMINA I, MOLINA P. Unmanned aerial systems for photogrammetry and remote sensing: a review [J]. ISPRS J. Photogram. Rem. Sens., 2014, 92: 79-97. |
| 5 | 陶惠林,徐良骥,冯海宽,等.基于无人机数码影像的冬小麦株高和生物量估算[J].农业工程学报,2019,35(19):107-116. |
| TAO H L, XU L J, FENG H K, et al.. Estimation of plant height and biomass of winter wheat based on UAV digital image [J]. Trans. Chin. Soc. Agric. Eng., 2019,35(19):107-116. | |
| 6 | 万亮,岑海燕,朱姜蓬,等.基于纹理特征与植被指数融合的水稻含水量无人机遥感监测[J].智慧农业,2020,2(1):58-67. |
| WAN L, CEN H Y, ZHU J P, et al.. Using fusion of texture features and vegetation indices from water concentration in rice crop to UAV remote sensing monitor [J]. Smart Agric.,2020,2(1):58-67. | |
| 7 | MUANGPRAKHON R, KAEWPLANG S. Estimation of paddy rice plant height using UAV remote sensing [J]. Eng. Access., 2021, 7(2): 93-97. |
| 8 | 邓江,谷海斌,王泽,等.基于无人机遥感的棉花主要生育时期地上生物量估算及验证[J].干旱地区农业研究,2019,37(5):55-61, 69. |
| DENG J, GU H B, WANG Z, et al.. Estimation and validation of above-ground biomass of cotton during main growth period using unmanned aerial vehicle (UAV) [J]. Agric. Res. Arid Areas, 2019,37(5):55-61, 69. | |
| 9 | DU X, WAN L, CEN H, et al.. Multi-temporal monitoring of leaf area index of rice under different nitrogen treatments using UAV images [J]. Int J. Precis Agric. Aviat., 2020, 3(1):7-12. |
| 10 | CÓRCOLES J I, ORTEGA J F, HERNÁNDEZ D, et al.. Estimation of leaf area index in onion (Allium cepa L.) using an unmanned aerial vehicle [J]. Biosyst. Eng., 2013, 115(1): 31-42. |
| 11 | 王来刚,徐建华,贺佳,等.基于无人机遥感的玉米叶面积指数与产量估算[J].玉米科学,2020,28(6):88-93. |
| WANG L G, XU J H, HE J, et al.. Estimating leaf area index and yield of maize based on remote sensing by unmanned aerial vehicle [J]. J. Maize Sci., 2020,28(6):88-93. | |
| 12 | 申洋洋,陈志超,胡昊,等.基于无人机多时相遥感影像的冬小麦产量估算[J].麦类作物学报,2021(10): 1298-1306. |
| SHEN Y Y, CHEN Z C, HU H, et al.. Estimation of water wheat yield based on UAV multi-temporal remote sensing image [J]. J. Triticeae Crops, 2021(10): 1298-1306. | |
| 13 | 汤勃,孔建益,伍世虔.机器视觉表面缺陷检测综述[J].中国图象图形学报,2017,22(12):1640-1663. |
| TANG B, KONG J Y, WU S Q. Review of surface defect detection based on machine vision [J]. J. Image. Graph., 2017,22(12):1640-1663. | |
| 14 | 周元琦,王敦亮,陈晨,等.基于无人机RGB图像颜色及纹理特征指数的小麦产量预测[J].扬州大学学报(农业与生命科学版),2021,42(3):110-116. |
| ZHOU Y Q, WANG D L, CHEN C, et al.. Prediction of wheat yield based on color index and texture feature index of unmanned aerial vehicle RGB images [J]. J. Yangzhou Univ. (Agric. Life Sci.), 2021,42(3):110-116. | |
| 15 | 刘欣谊,仲晓春,陈晨,等.利用无人机图像颜色与纹理特征数据在小麦生育前期对产量进行预测[J].麦类作物学报,2020,40(8):1002-1007. |
| LIU X Y, ZHONG X C, CHEN C, et al.. Prediction of wheat yield using color and texture feature data of UAV image at early growth stage [J]. J. Triticeae Crops, 2020,40(8):1002-1007. | |
| 16 | 兰铭,费帅鹏,禹小龙,等.多光谱与热红外数据融合在冬小麦产量估测中的应用[J].麦类作物学报,2021,41(12): 1564-1572. |
| LAN M, FEI S P, YU X L, et al.. Application of multispectral and thermal infrared data fusion in estimation of winter wheat yield [J]. J. Triticeae Crops, 2021,41(12): 1564-1572. | |
| 17 | 李昂. 基于无人机数码影像的水稻产量估测研究[D].沈阳:沈阳农业大学, 2018. |
| LI A. Research on rice yield estimation based on digital imaging of UAV [D]. Shenyang: Shenyang Agricultural University, Master Dissertation, 2018. | |
| 18 | 胡莉婷,潘学标,王雪姣,等.基于COSIM模型的棉花区域产量动态预测研究——以新疆阿克苏市为例[J].棉花学报,2018,30(1):83-91. |
| HU L T, PAN X B, WANG X J, et al.. Dynamic prediction of cotton regional yield based on the COSIM model-A case study of Akesu city, Xinjiang [J]. Cotton Sci., 2018,30(1):83-91. | |
| 19 | 王雪姣,潘学标,王森,等.基于COSIM模型的新疆棉花产量动态预报方法[J].农业工程学报,2017,33(8):160-165. |
| WANG X J, PAN X B, WANG S, et al.. Dynamic prediction method for cotton yield based on COSIM model in Xinjiang [J]. Trans. Chin. Soc. Agric. Eng., 2017,33(8):160-165. | |
| 20 | 刘焕军,康苒, SUSAN U,等.基于时间序列高光谱遥感影像的田块尺度作物产量预测[J].光谱学与光谱分析,2016,36(8):2585-2589. |
| LIU H J, KANG R, SUSAN U, et al.. Study on the prediction of cotton yield within field scale with time series hyperspectral imagery [J]. Spectrosc. Spectral Anal., 2016,36(8):2585-2589. | |
| 21 | 毛文华,王一鸣,张小超,等.基于机器视觉的田间杂草识别技术研究进展[J].农业工程学报,2004(5):43-46. |
| MAO W H, WANG Y M, ZHANG X C, et al.. Research advances of weed identification technology using machine vision [J]. Trans. Chin. Soc. Agric. Eng., 2004(5):43-46. | |
| 22 | LI S, YUAN F, ATA-UI-KARIM S T, et al.. Combining color indices and textures of UAV-based digital imagery for rice LAI estimation [J/OL]. Remote Sens., 2019, 11(15): 1763 [2021-10-27]. . |
| 23 | MAO W, WANG Y, WANG Y. Real-time detection of between-row weeds using machine vision [C/OL]// Proceedings of ASAE Annual Meeting. American Society of Agricultural and Biological Engineers, 2003:031004 [2021-10-27]. . |
| 24 | MEYER G E, NETO J C. Verification of color vegetation indices for automated crop imaging applications [J]. Comput. Electron. agric., 2008, 63(2): 282-293. |
| 25 | BENDIG J, YU K, AASEN H, et al.. Combining UAV-based plant height from crop surface models, visible, and near infrared vegetation indices for biomass monitoring in barley [J]. Int. J. Appl. Earth Obs., 2015, 39: 79-87. |
| 26 | LOUHAICHI M, BORMAN M M, JOHNSON D E. Spatially located platform and aerial photography for documentation of grazing impacts on wheat [J]. Geocart. Int., 2001, 16(1): 65-70. |
| 27 | 唐银凤,黄志明,黄荣娟,等.基于多特征提取和SVM分类器的纹理图像分类[J].计算机应用与软件,2011,28(6):22-25, 46. |
| TANG Y F, HUANG Z M, HUANG R J, et al.. Texture image classification based on multi-feature extraction and SVM classifier [J]. Comput. Appl. Software, 2011,28(6):22-25, 46. | |
| 28 | TAMURA H, MORI S, YAMAWAKI T. Textural features corresponding to visual perception [J]. IEEE Trans. Syst. Man. Cybern., 1978, 8(6): 460-473. |
| 29 | 王顺杰,齐春,程玉胜.Tamura纹理特征在水下目标分类中的应用[J].应用声学,2012,31(2):135-139. |
| WANG S J, QI C, CHENG Y S. Application of Tamura texture feature to classify underwater targets [J]. J. Appl. Acoust., 2012,31(2):135-139. | |
| 30 | 周鹏飞,卢泽雨.基于SPSS多元线性回归模型在城市用水量的预测[J].水利科技与经济,2018,24(5):6-10. |
| ZHOU P F, LU Z Y. Prediction of urban water consumption based on SPSS multiple linear regression model [J]. Water Conservancy Sci. Technol. Econ., 2018,24(5):6-10. | |
| 31 | 李凤.因子分析的原理与应用[J].产业与科技论坛,2014,13(10):76-77. |
| LI F. Principle and application of factor analysis [J]. Ind. Sci. Tribune, 2014,13(10):76-77. | |
| 32 | 龚红菊.基于分形理论及图像纹理分析的水稻产量预测方法研究[D].南京:南京农业大学, 2008. |
| GONG H J. Estimating paddy yield based on fractal and image texture analysis. [D]. Nanjing: Nanjing Agricultural University, 2008. | |
| 33 | 刘焕军,孟令华,张新乐,等.基于时间序列Landsat影像的棉花估产模型[J].农业工程学报,2015,31(17):215-220. |
| LIU H J, MENG L H, ZHANG X L, et al.. Estimation model of cotton yield with time series Landsat images [J]. Trans. Chin. Soc. Agric. Eng., 2015,31(17):215-220. | |
| 34 | BENDIG J, BOLTEN A, BENNERTZ S, et al.. Estimating biomass of barley using crop surface models (CSMs) derived from UAV-based RGB imaging [J]. Remote Sens., 2014, 6(11): 10395-10412. |
| 35 | 毛树春,李亚兵,董合忠,等.中国棉花栽培学[M].第四版.上海:上海科学技术出版社,2019:405-410. |
| 36 | 徐永胜,刘浩然,范伟伟,等.基于分水岭算法的无人机不同飞行高度下林木冠幅提取研究[J].西北林学院学报,2021,36(3):197-202, 259. |
| XU Y S, LIU H R, FAN W W, et al.. Extraction of forest stand crown width at different flying heights of UAV based on watershed Algorithm [J]. J. Northwest Forestry Univ.,2021,36(3):197-202, 259. | |
| 37 | 张佩,陈郑盟,马顺登,等.用冠层叶色偏态分布模式RGB模型预测大豆产量[J].农业工程学报,2021,37(9):120-126. |
| ZHANG P, CHEN Z M, MA S D, et al.. Prediction of soybean yield by using RGB model with skew distribution pattern of canopy leaf color [J]. Trans. Chin. Soc. Agric. Eng., 2021,37(9):120-126. | |
| 38 | 唐晏. 基于无人机采集图像的植被识别方法研究[D].成都:成都理工大学,2014. |
| TANG Y. Research on the vegetation identification method based on UAV image acquisition [D]. Chengdu: Chengdu University of Technology, 2014. | |
| 39 | 郑小南,杨凡,李富忠.农作物图像分割算法综述[J].现代计算机,2020(19):72-75. |
| ZHENG X N, YANG F, LI F Z. Overview of crop image segmentation algorithm [J]. Mod. Comput., 2020(19):72-75. |
| [1] | 卢闯, 胡海棠, 覃苑, 淮贺举, 李存军. 基于无人机多光谱影像的春玉米田管理分区研究[J]. 中国农业科技导报, 2022, 24(9): 106-115. |
| [2] | 胡灵炆, 周忠发, 尹林江, 朱孟, 黄登红. 基于无人机RGB影像的苗期油菜识别[J]. 中国农业科技导报, 2022, 24(9): 116-128. |
| [3] | 刘阳阳, 潘越, 王世伟, 虎海防. 不同山葡萄品种光响应模型拟合及综合评价[J]. 中国农业科技导报, 2022, 24(2): 104-114. |
| [4] | 张冠宏, 王新军, 徐晓龙, 闫立男, 常梦迪, 李永康, . 基于面向对象的无人机遥感影像荒漠植被分类[J]. 中国农业科技导报, 2021, 23(5): 69-77. |
| [5] | 伏荣桃,陈诚,王剑,陈雪娟,卢代华*. 植保无人机对水稻病虫害防治条件与防效的研究[J]. 中国农业科技导报, 2021, 23(4): 103-109. |
| [6] | 周恺1,周彤1,丁峰2,丁大伟2,武威1,姚照胜1,刘涛1,霍中洋1,孙成明1*. 基于无人机图像的小麦主要生育时期LAI估算[J]. 中国农业科技导报, 2021, 23(1): 89-97. |
| [7] | 王冰洁1,潘波1,姜蕾1,林勇1*,赵帅2,莫宇星2. 植保无人机作业参数对雾滴在火龙果树冠层沉积分布的影响[J]. 中国农业科技导报, 2020, 22(10): 101-109. |
| [8] | 徐朋1,徐伟诚2,罗阳帆2,赵祚喜2*. 基于无人机可见光遥感影像的耕地精准分类方法研究[J]. 中国农业科技导报, 2019, 21(6): 79-86. |
| [9] | 徐伟诚1,陈凯1,张铭1,李正风2,张天顺1*. 基于太阳能的植保无人机续航提升方案[J]. 中国农业科技导报, 2018, 20(11): 62-68. |
| [10] | 赵蓉蓉1,邵惠芳1*,范磊2,张慢慢3,王杉杉1,陈芳泉1,刘志宏1,牛桂言1,郝浩浩4,许自成1. 烘丝工序烟丝化学成分与感官质量的关系分析[J]. 中国农业科技导报, 2017, 19(2): 93-102. |
| [11] | 李燕1,褚智国2,田海英3,郝辉3,宋金勇3,周浩3,李怀奇3,刘鹏飞1,赵铭钦1*. 初烤烟叶有机酸对主流烟气有害成分释放量的影响[J]. 中国农业科技导报, 2017, 19(1): 125-130. |
| [12] | 梁菲,窦学诚*. 生态产业链和价值链视角下的甘肃省循环农业耦合度分析[J]. 中国农业科技导报, 2016, 18(2): 200-207. |
| [13] | 艾洪娟1,2,蒋和平1*. 基于因子分析法的新疆现代农业发展水平评价研究[J]. , 2015, 17(4): 157-164. |
| [14] | 黄永宝1,纪延光2*. 基于因子分析的我国农业机械发展分析研究[J]. , 2014, 16(4): 95-101. |
| [15] | 牛莉莉1|张保全2,许自成1*,耿宗泽3,黄广华2,刘超1. 不同口感特性烤烟中性香气物质含量的差异分析[J]. , 2014, 16(2): 100-108. |
| 阅读次数 | ||||||
|
全文 |
|
|||||
|
摘要 |
|
|||||
 京公网安备11010802021197号