


中国农业科技导报 ›› 2025, Vol. 27 ›› Issue (8): 155-167.DOI: 10.13304/j.nykjdb.2024.0827
• 生物制造 资源生态 • 上一篇
王潇( ), 辛翔飞(), 闫琰, 王济民
收稿日期:2024-10-10
接受日期:2024-12-26
出版日期:2025-08-15
发布日期:2025-08-26
通讯作者:
辛翔飞
作者简介:王潇 E-mail:wx2023caas@163.com;
基金资助:
Xiao WANG(), Xiangfei XIN(), Yan YAN, Jimin WANG
Received:2024-10-10
Accepted:2024-12-26
Online:2025-08-15
Published:2025-08-26
Contact:
Xiangfei XIN
摘要:
运用生命周期评价法和广义迪氏分解法,对山东省畜牧业碳排放的演变特征以及驱动因素进行分析。结果表明,2011—2022年山东省畜牧业碳排放总量由6 360.91万 t下降到5 576.21万 t,年均增长率为-1.19%。其中肠道发酵和粪便管理系统碳排放量的占比逐渐减少,2019年饲料消耗系统的占比超过胃肠发酵与粪便管理系统,成为最主要的碳排放来源。从畜种来看,禽碳排放占比最大,且其碳排放总量呈增长趋势。从时空序列来看,临沂、潍坊、菏泽的碳排放总量较大,泰安、青岛和济宁的碳排放强度较低。综合驱动因素来看,机械总动力消耗碳强度及经济产出碳强度是主要的促降因素,机械总动力消耗强度的促降效应相对较低。综上表明,调整产业结构、提高畜禽生产效率和效益是未来畜牧业提高资源利用效率的有效途径;在引进先进低碳畜牧业机械设备的同时,提高畜牧机械利用效率是未来山东省畜牧业绿色发展的重要方向。
中图分类号:
王潇, 辛翔飞, 闫琰, 王济民. 山东省畜牧业碳排放演变特征及驱动因素分析[J]. 中国农业科技导报, 2025, 27(8): 155-167.
Xiao WANG, Xiangfei XIN, Yan YAN, Jimin WANG. Analysis of Evolution Characteristics and Driving Factors of Carbon Emission from Animal Husbandry in Shandong Province[J]. Journal of Agricultural Science and Technology, 2025, 27(8): 155-167.
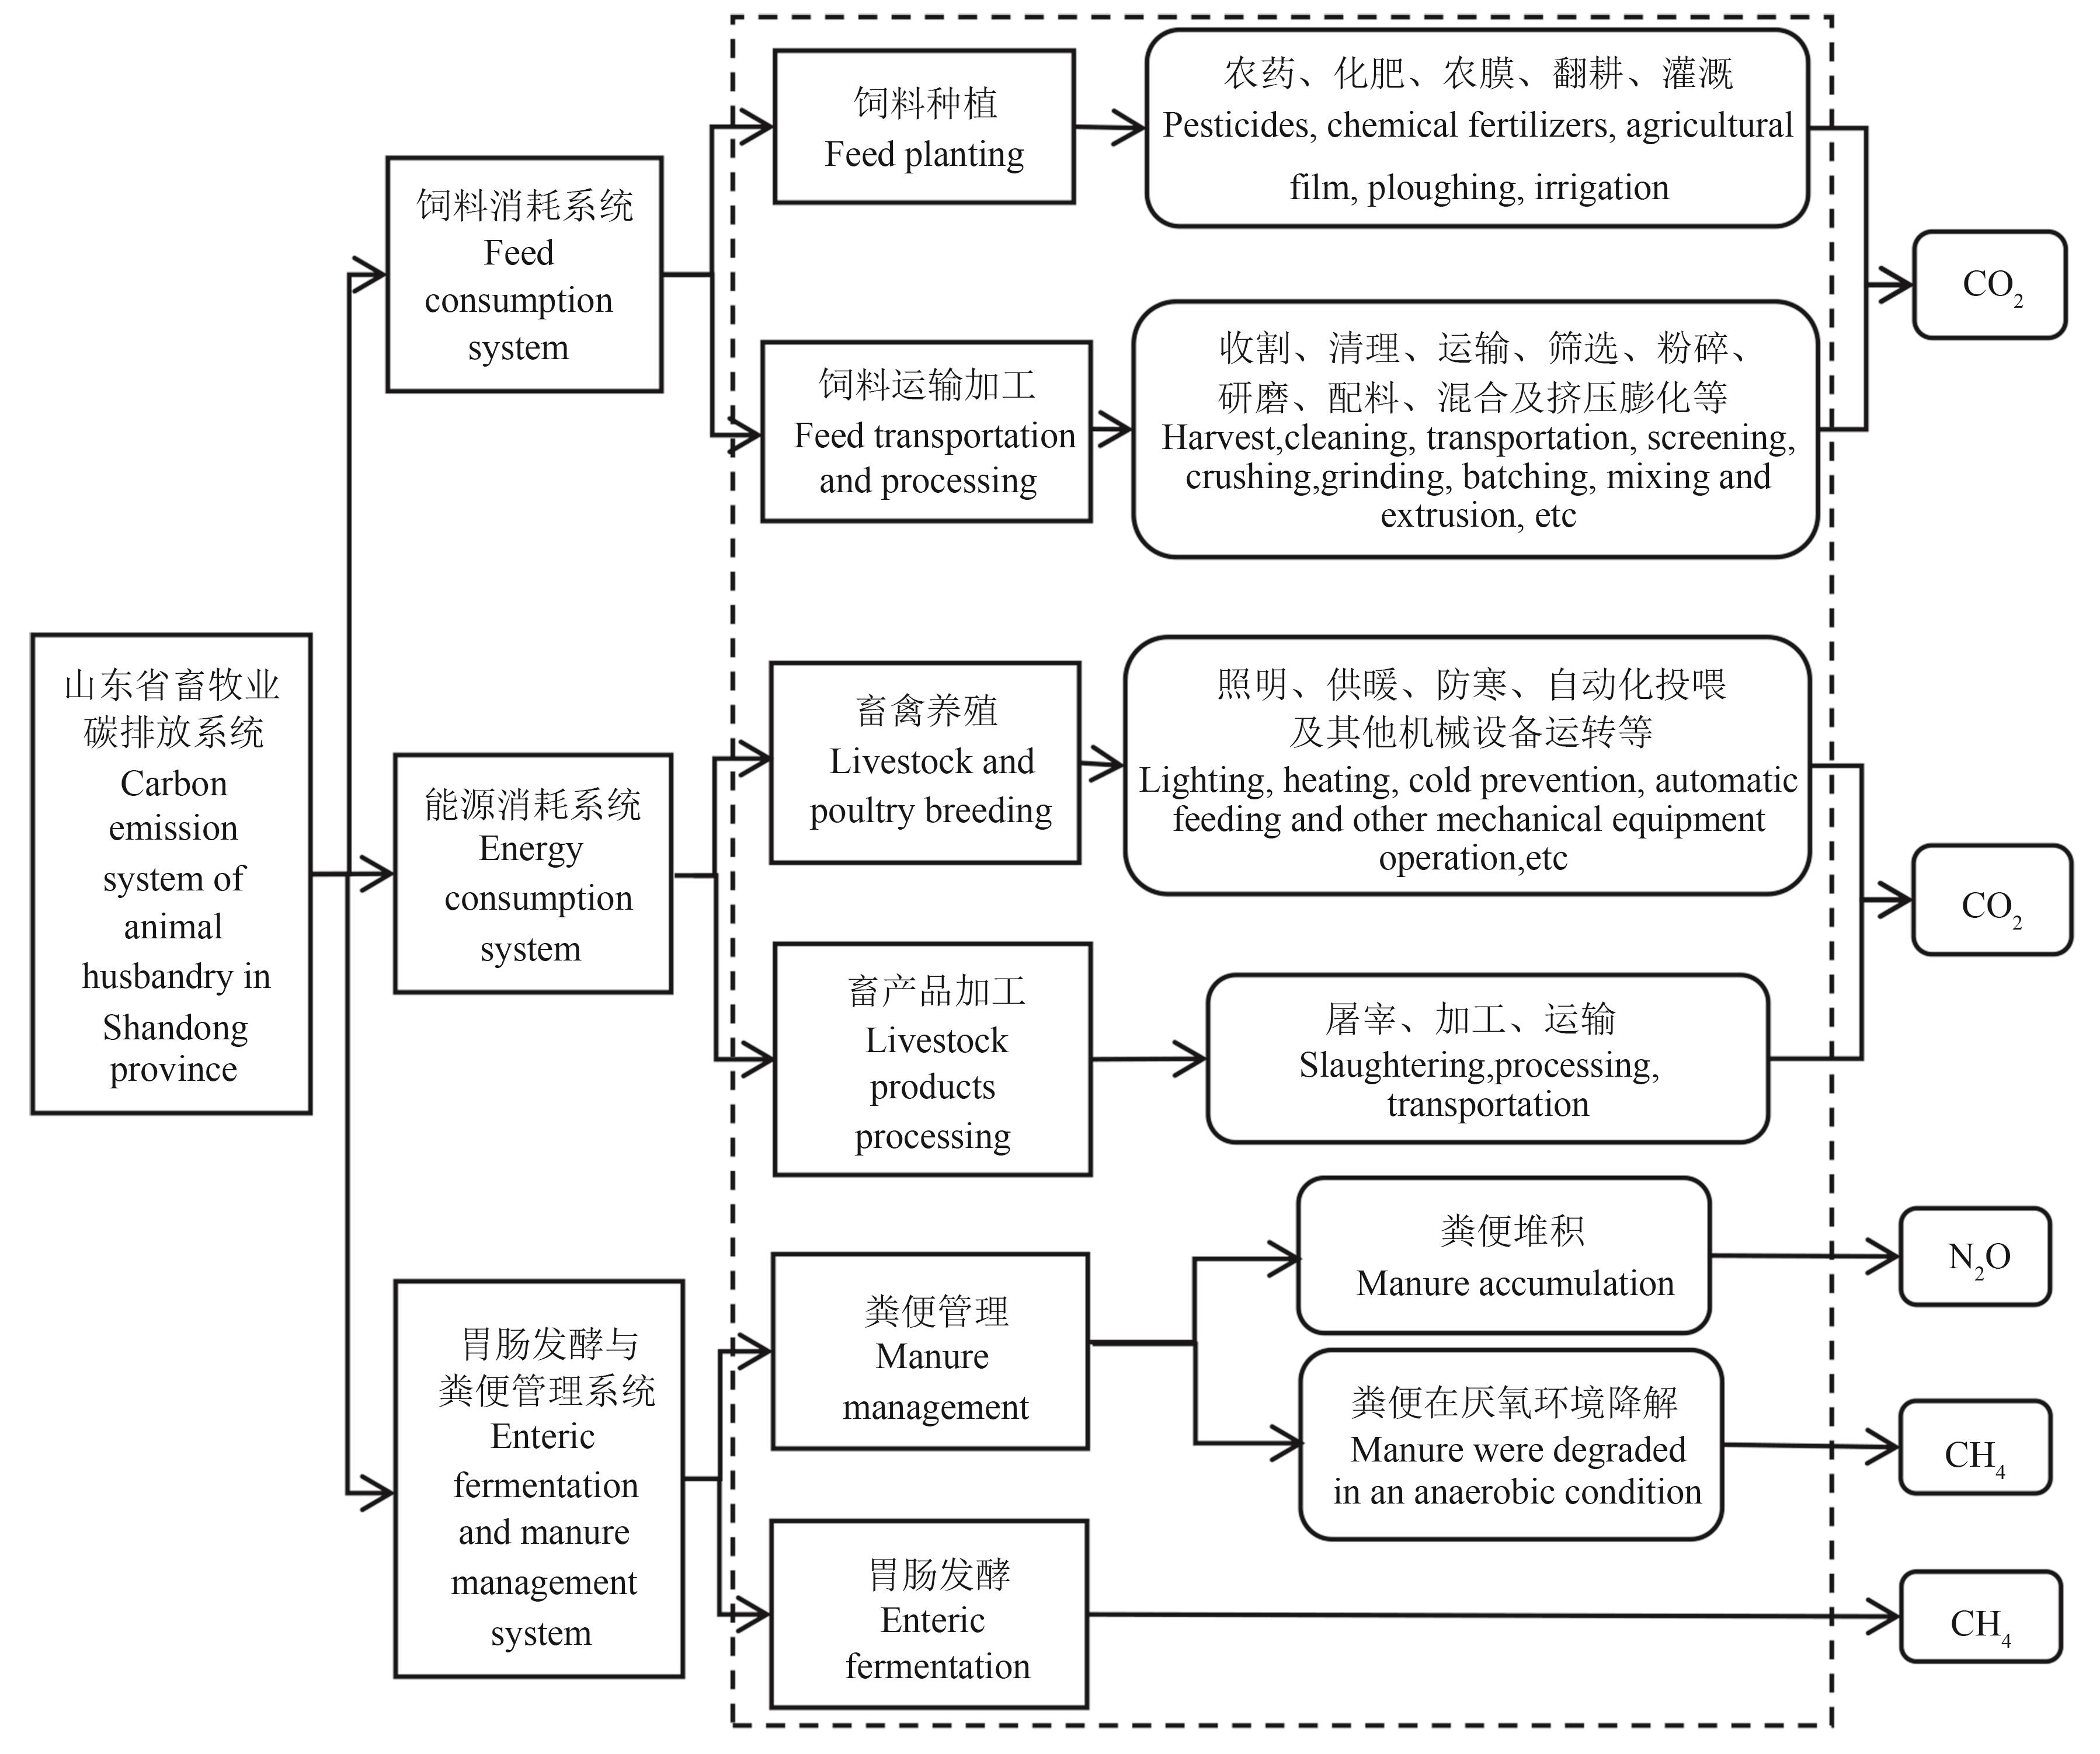
图1 山东省畜牧业碳排放系统注: 粪便堆积和厌氧降解过程中也会产生CO2,但在方法学中不计入。
Fig. 1 Carbon emission system of animal husbandry in Shandong provinceNote: CO2 is also produced during manure accumulation and anaerobic degradation, but is not included in the methodology.
物种 Species | 肠道发酵 Enteric fermentation | 粪便管理 Manure management | 参考来源 Reference source | |
|---|---|---|---|---|
| CH4 | CH4 | N2O | ||
| 猪Swine | 1.000 | 3.50 | 0.53 | [ |
| 禽Poultry | 0.000 | 0.02 | 0.02 | [ |
| 牛Cattle | 55.000 | 2.00 | 1.34 | [ |
| 羊 | 5.000 | 0.16 | 0.33 | [ |
| 兔Rabbit | 0.254 | 0.08 | 0.02 | [ |
表1 各物种胃肠发酵及粪便管理碳排放系数
Table 1 Carbon emission coefficient of enteric fermentation and manure management of each animal species
物种 Species | 肠道发酵 Enteric fermentation | 粪便管理 Manure management | 参考来源 Reference source | |
|---|---|---|---|---|
| CH4 | CH4 | N2O | ||
| 猪Swine | 1.000 | 3.50 | 0.53 | [ |
| 禽Poultry | 0.000 | 0.02 | 0.02 | [ |
| 牛Cattle | 55.000 | 2.00 | 1.34 | [ |
| 羊 | 5.000 | 0.16 | 0.33 | [ |
| 兔Rabbit | 0.254 | 0.08 | 0.02 | [ |
系统边界 System boundary | 符号 Sign | 指标 Index | 值 Value | 参考来源 Reference source |
|---|---|---|---|---|
饲料粮种植消耗 Feed and grain planting consumption | ej1 | 小麦碳排放系数 Carbon emission coefficient of wheat | 1.22 | [ |
玉米碳排放系数 Carbon emission coefficient of corn | 1.5 | |||
饲料粮加工消耗 Feed and grain processing consumption | ej2 | 小麦碳排放系数 Carbon emission coefficient of wheat | 0.031 9 | |
玉米碳排放系数 Carbon emission coefficient of corn | 0.010 2 | |||
大豆碳排放系数 Carbon emission coefficient of soybean | 0.101 3 | |||
畜禽饲养消耗 Livestock and poultry feeding consumption | pricee | 畜禽养殖用电单价/(元·kW-1·h-1)Unit price of livestock and poultry breeding electricity consumption/(yuan·kW-1·h-1) | 0.427 5 | [ |
| pricec | 畜禽养殖用煤单价/(元·t-1) Unit price of coal used for livestock and poultry breeding/(yuan·t-1) | 800 | ||
| ef | 电能消耗碳排放系数 Carbon emission coefficient of electricity consumption/(t·MW-1·t-1) | 0.971 4 | [ | |
| ec | 煤炭消耗碳排放系数 Carbon emission coefficient of coal consumption | 1.98 | [ | |
畜禽加工消耗 Consumption of livestock and poultry processing | MJ u | 牛肉屠宰加工耗能系数 Energy consumption coefficient of beef slaughtering and processing/(MJ·kg-1) | 4.37 | [ |
猪肉屠宰加工耗能系数 Energy consumption coefficient of pork slaughtering and processing/(MJ·kg-1) | 3.76 | |||
羊肉屠宰加工耗能系数 Energy consumption coefficient of mutton slaughtering and processing/(MJ·kg-1) | 10.4 | |||
禽肉屠宰加工耗能系数 Energy consumption coefficient of poultry slaughtering and processing/(MJ·kg-1) | 2.59 | |||
| 禽蛋屠宰加工耗能系数Energy consumption coefficient of poultry egg slaughtering and processing/(MJ·kg-1) | 8.16 |
表2 生命周期评价法各系统边界的碳排放系数
Table 2 Carbon emission coefficient of each system by the life cycle assessment method
系统边界 System boundary | 符号 Sign | 指标 Index | 值 Value | 参考来源 Reference source |
|---|---|---|---|---|
饲料粮种植消耗 Feed and grain planting consumption | ej1 | 小麦碳排放系数 Carbon emission coefficient of wheat | 1.22 | [ |
玉米碳排放系数 Carbon emission coefficient of corn | 1.5 | |||
饲料粮加工消耗 Feed and grain processing consumption | ej2 | 小麦碳排放系数 Carbon emission coefficient of wheat | 0.031 9 | |
玉米碳排放系数 Carbon emission coefficient of corn | 0.010 2 | |||
大豆碳排放系数 Carbon emission coefficient of soybean | 0.101 3 | |||
畜禽饲养消耗 Livestock and poultry feeding consumption | pricee | 畜禽养殖用电单价/(元·kW-1·h-1)Unit price of livestock and poultry breeding electricity consumption/(yuan·kW-1·h-1) | 0.427 5 | [ |
| pricec | 畜禽养殖用煤单价/(元·t-1) Unit price of coal used for livestock and poultry breeding/(yuan·t-1) | 800 | ||
| ef | 电能消耗碳排放系数 Carbon emission coefficient of electricity consumption/(t·MW-1·t-1) | 0.971 4 | [ | |
| ec | 煤炭消耗碳排放系数 Carbon emission coefficient of coal consumption | 1.98 | [ | |
畜禽加工消耗 Consumption of livestock and poultry processing | MJ u | 牛肉屠宰加工耗能系数 Energy consumption coefficient of beef slaughtering and processing/(MJ·kg-1) | 4.37 | [ |
猪肉屠宰加工耗能系数 Energy consumption coefficient of pork slaughtering and processing/(MJ·kg-1) | 3.76 | |||
羊肉屠宰加工耗能系数 Energy consumption coefficient of mutton slaughtering and processing/(MJ·kg-1) | 10.4 | |||
禽肉屠宰加工耗能系数 Energy consumption coefficient of poultry slaughtering and processing/(MJ·kg-1) | 2.59 | |||
| 禽蛋屠宰加工耗能系数Energy consumption coefficient of poultry egg slaughtering and processing/(MJ·kg-1) | 8.16 |
系统边界 System boundary | 符号 Sign | 指标 Index | 值 Value | 参考来源 Reference source |
|---|---|---|---|---|
畜禽加工消耗 Consumption of livestock and poultry processing | MJ u | 牛奶屠宰加工耗能系数 Energy consumption coefficient of milk slaughtering and processing/(MJ·kg-1) | 1.12 | [ |
| v | Unit electric heat value | 3.6 | ||
CH4全球升温潜能值 CH4 global warming potential value | 21 | [ | ||
N2O全球升温潜能值 N2O global warming potential value | 310 |
表2 生命周期评价法各系统边界的碳排放系数 (续表Continued)
Table 2 Carbon emission coefficient of each system by the life cycle assessment method
系统边界 System boundary | 符号 Sign | 指标 Index | 值 Value | 参考来源 Reference source |
|---|---|---|---|---|
畜禽加工消耗 Consumption of livestock and poultry processing | MJ u | 牛奶屠宰加工耗能系数 Energy consumption coefficient of milk slaughtering and processing/(MJ·kg-1) | 1.12 | [ |
| v | Unit electric heat value | 3.6 | ||
CH4全球升温潜能值 CH4 global warming potential value | 21 | [ | ||
N2O全球升温潜能值 N2O global warming potential value | 310 |
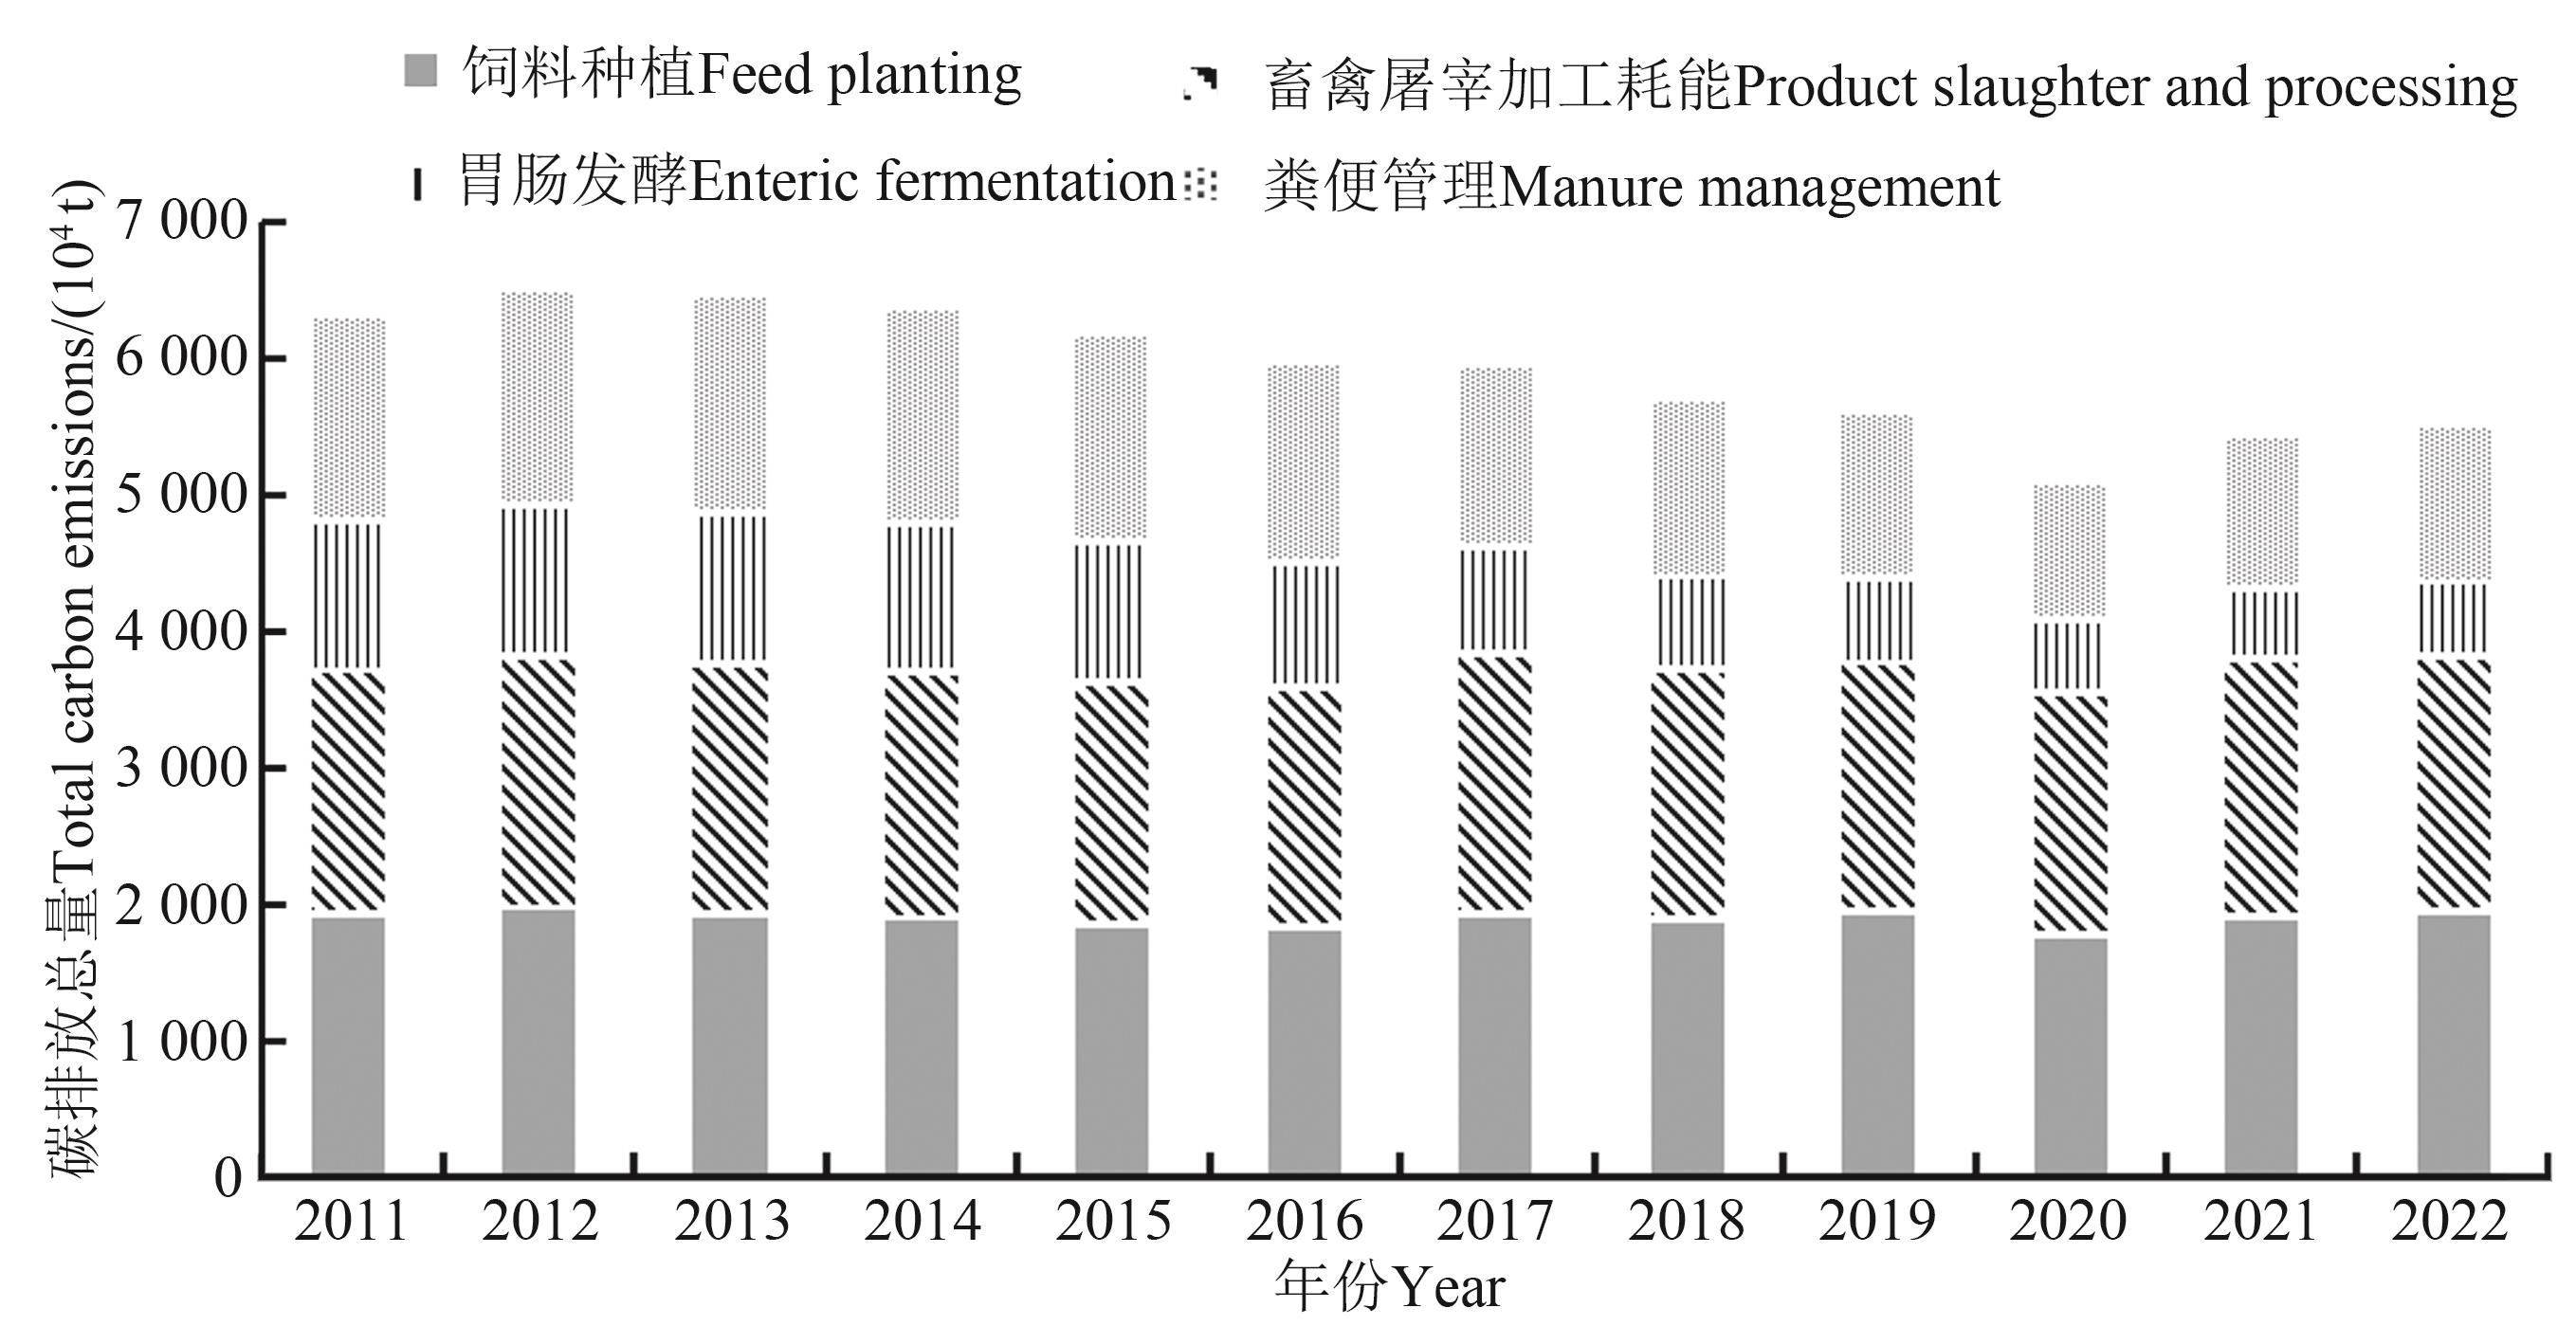
图2 2011—2022年山东省碳排放总量注: 由于饲料加工环节和畜禽养殖耗能环节的碳排放量相对较少,相对于其他碳排放源可以忽略不计,因此在图中未列出。
Fig. 2 Total carbon emission of Shandong province from 2011 to 2022Note: Because the carbon emissions of feed processing and livestock and poultry breeding are relatively small and negligible from other carbon emission sources, they are not listed in the figure.
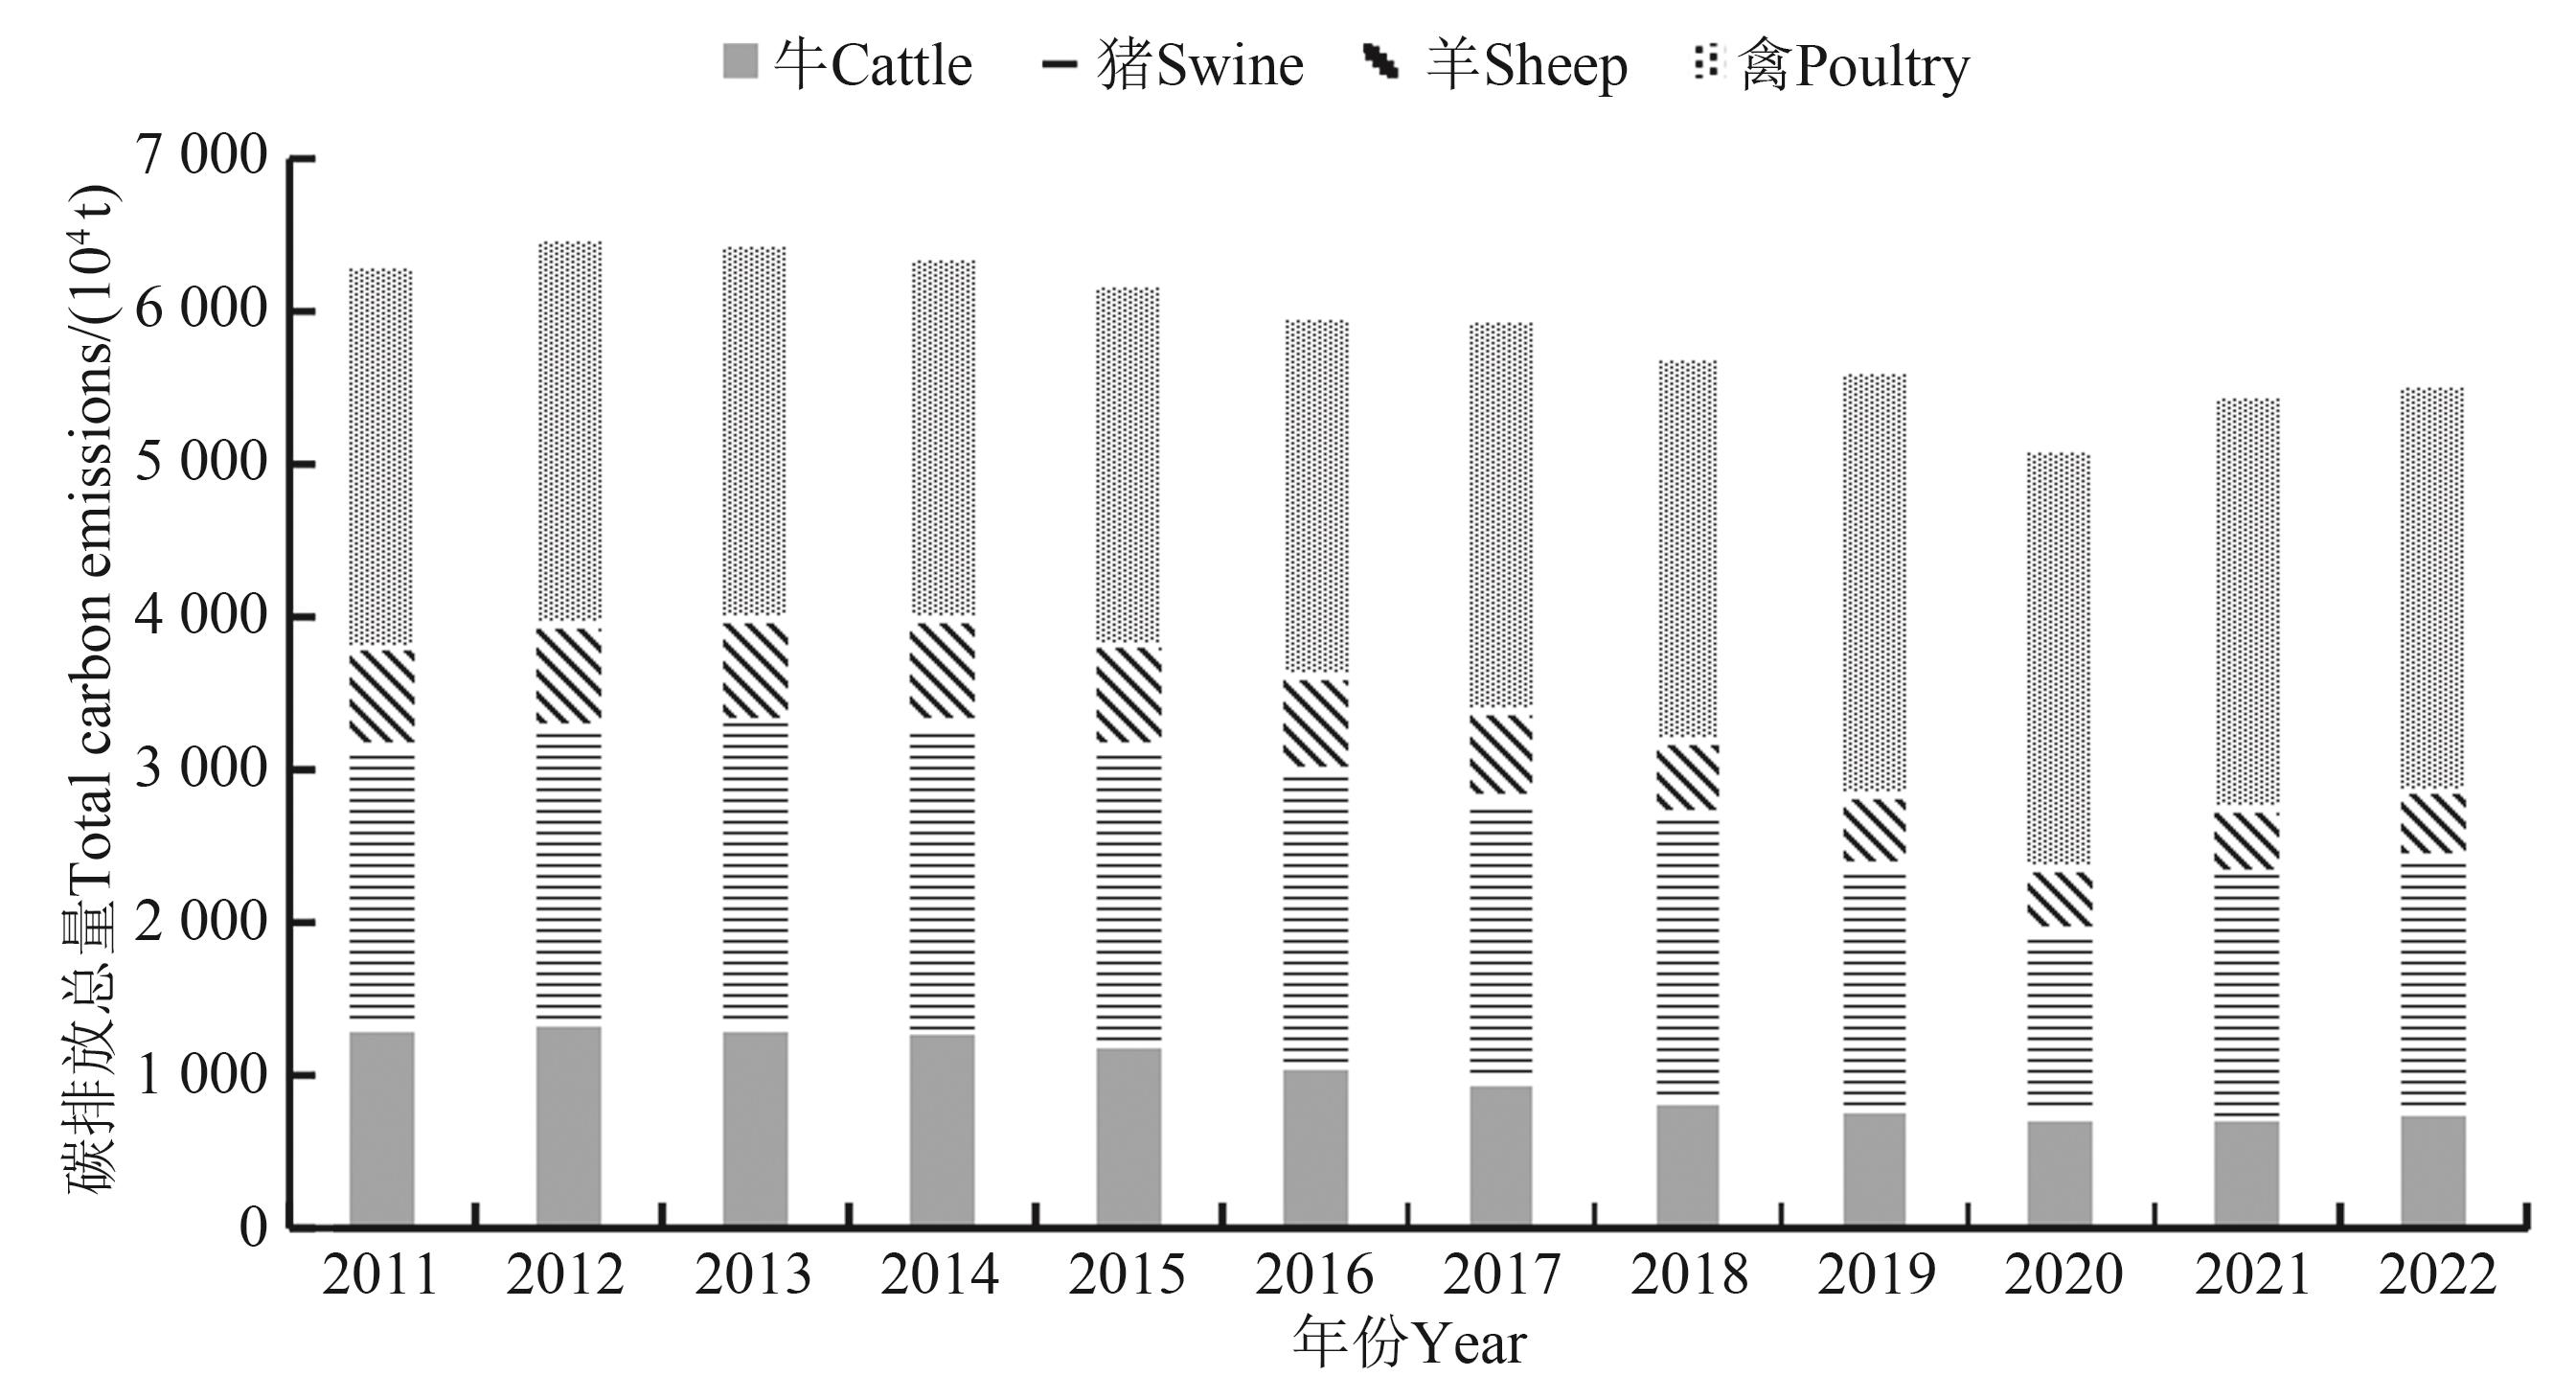
图3 2011—2022年山东省各畜牧品种碳排放总量注: 由于兔碳排放量相对较少,相对于其他物种可以忽略不计,因此在图中未列出。
Fig. 3 Total carbon emission of all livestock breeds in Shandong province from 2011 to 2022Note: Because rabbits have carbon emissions of rabit is relatively low, and is it negligible to other livestock species, it is not listed in the figure.
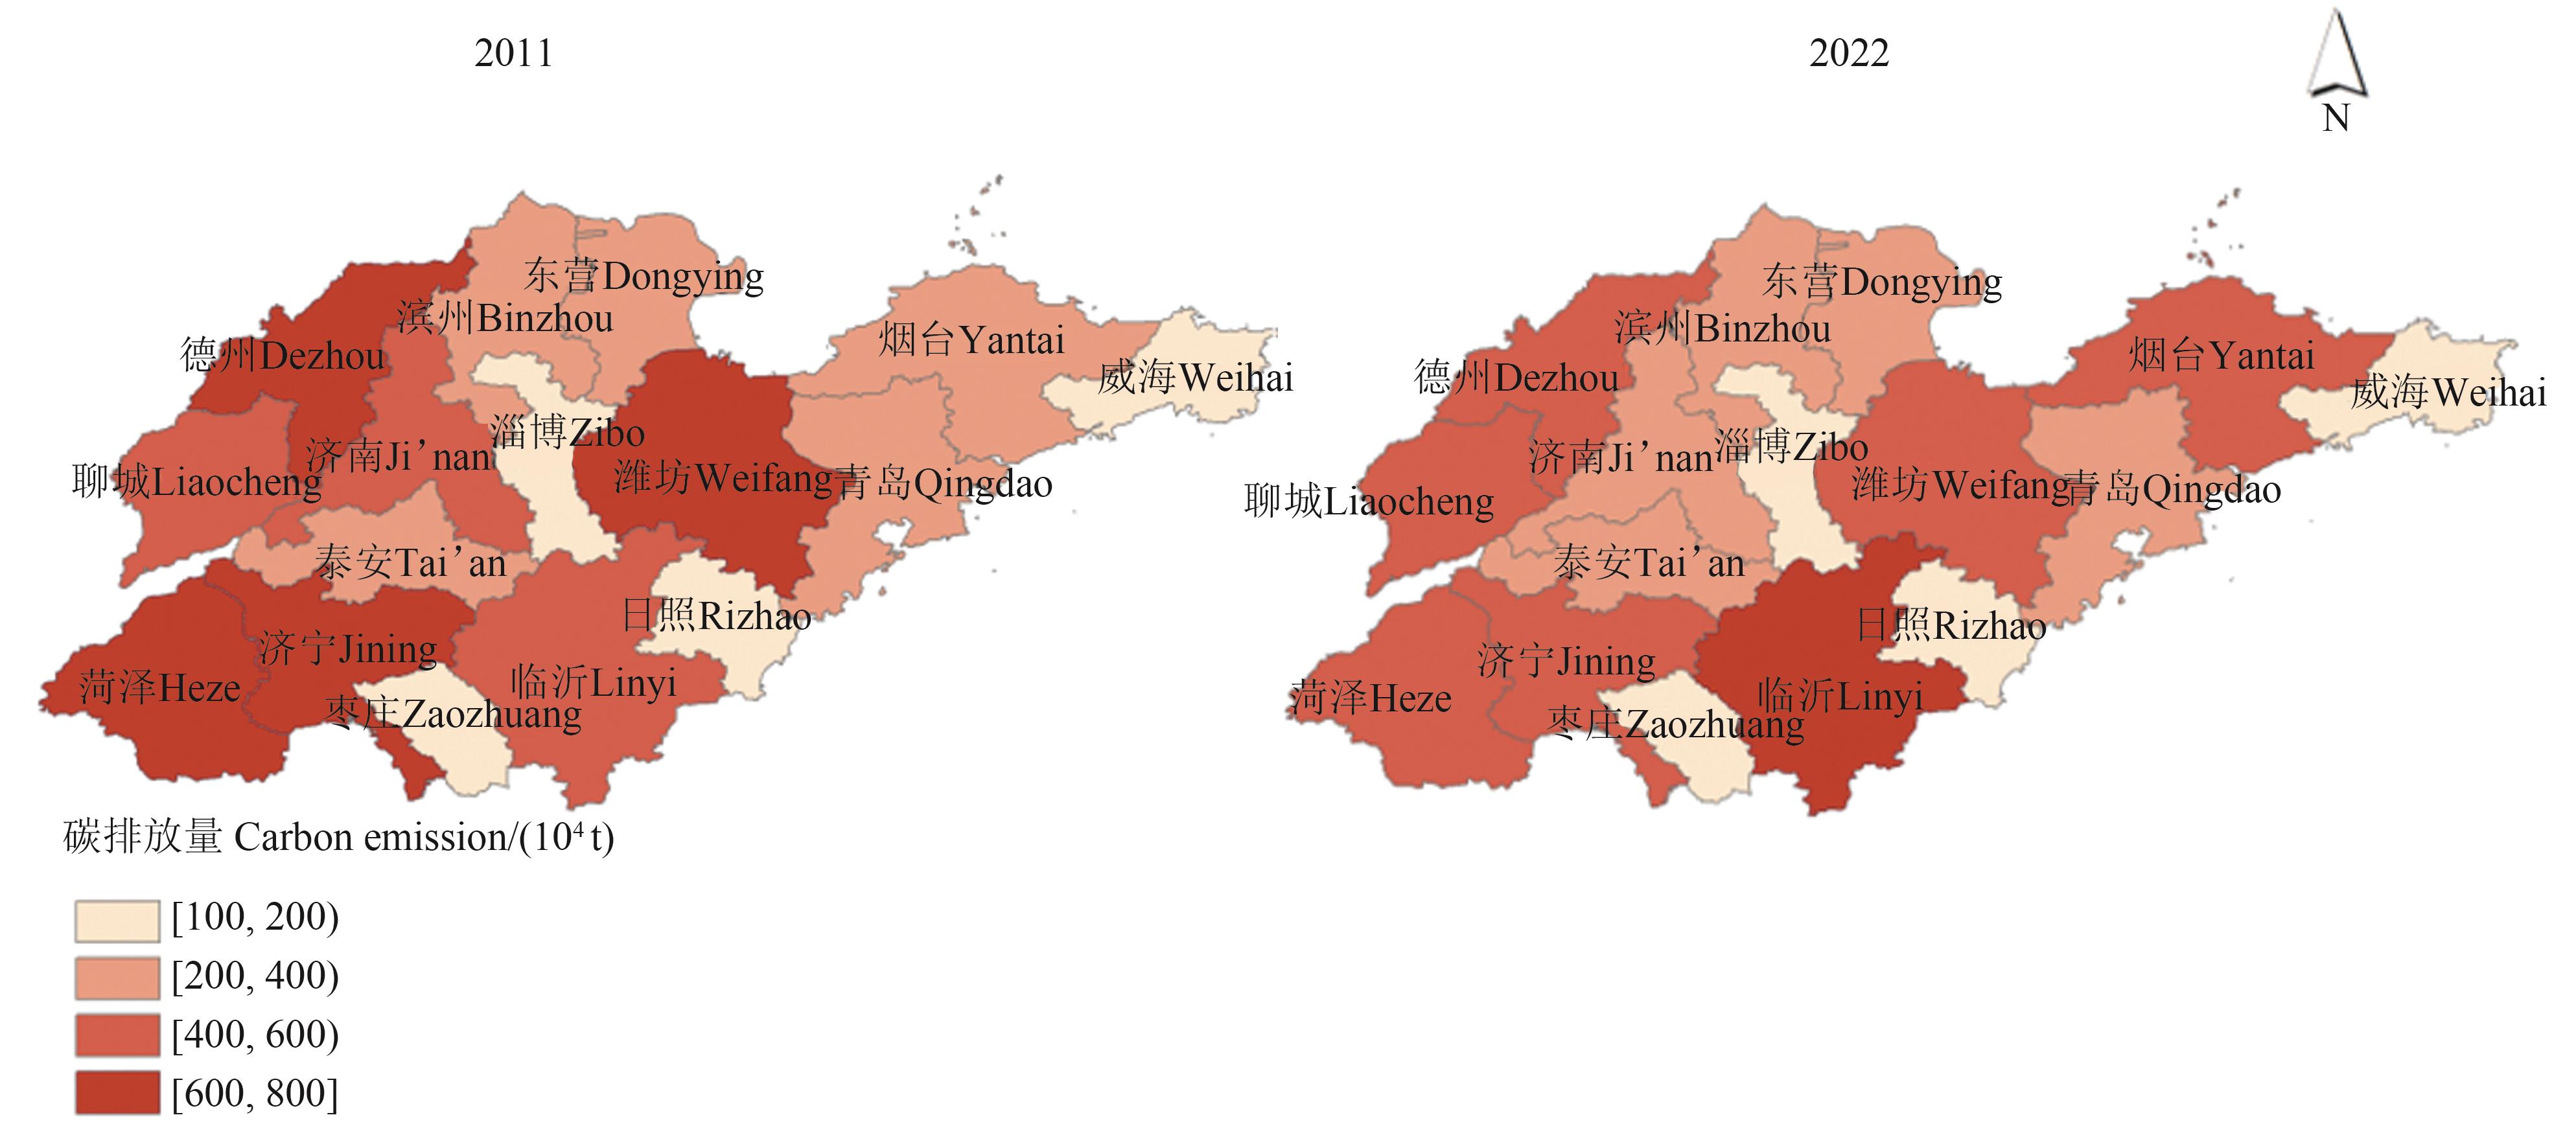
图4 山东省畜牧业碳排放空间分布注:基于自然资源部标准地图服务网站GS(2024)1158号标准地图绘制,底图无修改。
Fig. 4 Spatial distribution diagram of carbon emission from animal husbandry in Shandong provinceNote:Based on the standard map GS(2024)1158 of the National Resources Ministry’s standard map service website, the base map has not been modified.
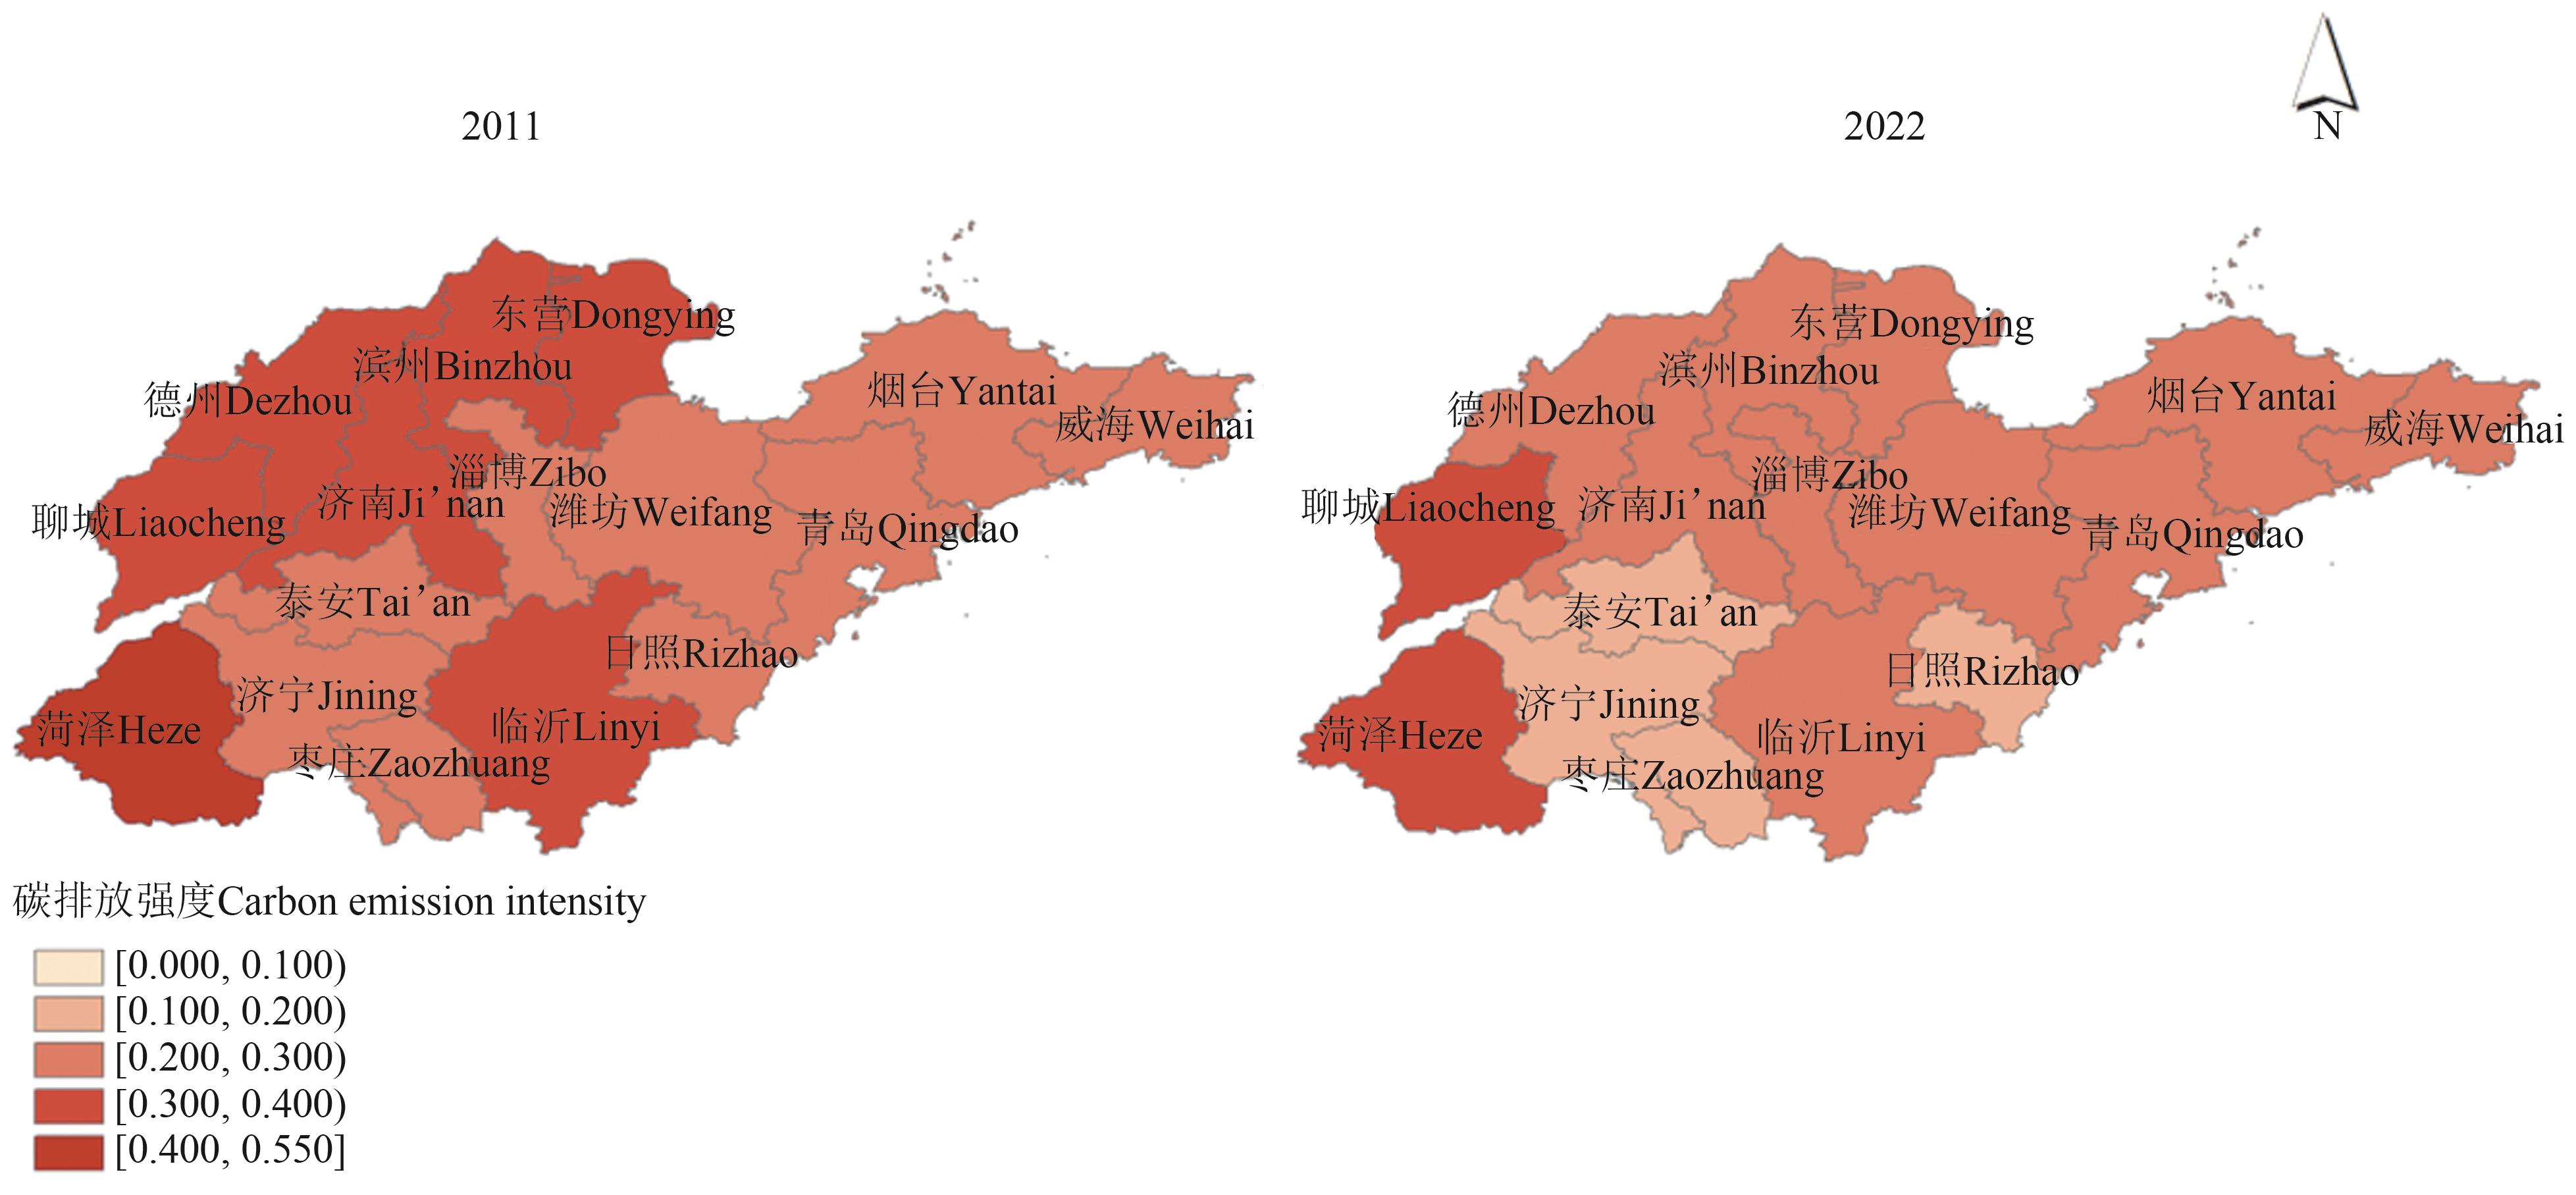
图5 山东省畜牧业碳排放强度空间分布注:基于自然资源部标准地图服务网站GS(2024)1158号标准地图绘制,底图无修改。
Fig. 5 Spatial distribution diagram of carbon emission intensity in animal husbandry in Shandong provinceNote:Based on the standard map GS(2024)1158 of the National Resources Ministry’s standard map service website, the base map has not been modified.
年份 Year | 经济发展水平 Level of economic development | 经济产出碳强度 Carbon intensity of economic output | 机械总动力水平 Total prime mover power capacity | 机械总动力消耗碳强度 Carbon intensity per unit of prime Mover power consumption | 人口规模 Population size | 人均碳排放量 Per capita carbon intensity | 人均产值 Per capita output | 机械总动力消耗强度 Prime mover power consumption intensity |
|---|---|---|---|---|---|---|---|---|
| 2012 | 0.009 0 | 0.000 7 | 0.033 5 | -0.022 7 | 0.001 5 | 0.008 3 | -0.000 2 | -0.001 0 |
| 2013 | 0.011 7 | -0.013 9 | 0.041 6 | -0.041 3 | 0.001 3 | -0.003 3 | -0.000 3 | -0.001 5 |
| 2014 | 0.003 2 | -0.007 8 | 0.004 5 | -0.009 1 | 0.002 1 | -0.006 8 | 0.000 0 | 0.000 0 |
| 2015 | 0.007 4 | -0.017 1 | 0.004 4 | -0.014 3 | 0.001 9 | -0.011 8 | 0.000 0 | 0.000 0 |
| 2016 | 0.014 1 | -0.025 0 | 0.006 0 | -0.017 4 | 0.003 5 | -0.015 0 | -0.000 1 | -0.000 1 |
| 2017 | -0.010 0 | 0.008 8 | 0.006 8 | -0.008 2 | 0.002 0 | -0.003 5 | -0.000 1 | -0.000 4 |
| 2018 | -0.016 7 | 0.003 6 | 0.008 0 | -0.021 1 | 0.001 4 | -0.014 9 | -0.000 4 | -0.000 9 |
| 2019 | -0.012 8 | 0.008 4 | 0.020 6 | -0.024 5 | 0.001 0 | -0.006 0 | -0.000 1 | -0.001 7 |
| 2020 | 0.011 7 | -0.042 0 | 0.0158 | -0.045 9 | 0.001 8 | -0.032 7 | -0.000 2 | 0.000 0 |
| 2021 | 0.038 3 | -0.015 1 | 0.055 6 | -0.031 4 | 0.000 2 | 0.023 2 | -0.002 6 | -0.000 7 |
| 2022 | 0.005 6 | -0.000 1 | 0.013 0 | -0.007 2 | -0.000 2 | 0.005 8 | -0.000 1 | -0.000 1 |
表3 2012—2022年山东省畜牧业碳排放驱动因素的贡献率
Table 3 Contribution rate of carbon emission drivers of animal husbandry in Shandong Province from 2012 to 2022
年份 Year | 经济发展水平 Level of economic development | 经济产出碳强度 Carbon intensity of economic output | 机械总动力水平 Total prime mover power capacity | 机械总动力消耗碳强度 Carbon intensity per unit of prime Mover power consumption | 人口规模 Population size | 人均碳排放量 Per capita carbon intensity | 人均产值 Per capita output | 机械总动力消耗强度 Prime mover power consumption intensity |
|---|---|---|---|---|---|---|---|---|
| 2012 | 0.009 0 | 0.000 7 | 0.033 5 | -0.022 7 | 0.001 5 | 0.008 3 | -0.000 2 | -0.001 0 |
| 2013 | 0.011 7 | -0.013 9 | 0.041 6 | -0.041 3 | 0.001 3 | -0.003 3 | -0.000 3 | -0.001 5 |
| 2014 | 0.003 2 | -0.007 8 | 0.004 5 | -0.009 1 | 0.002 1 | -0.006 8 | 0.000 0 | 0.000 0 |
| 2015 | 0.007 4 | -0.017 1 | 0.004 4 | -0.014 3 | 0.001 9 | -0.011 8 | 0.000 0 | 0.000 0 |
| 2016 | 0.014 1 | -0.025 0 | 0.006 0 | -0.017 4 | 0.003 5 | -0.015 0 | -0.000 1 | -0.000 1 |
| 2017 | -0.010 0 | 0.008 8 | 0.006 8 | -0.008 2 | 0.002 0 | -0.003 5 | -0.000 1 | -0.000 4 |
| 2018 | -0.016 7 | 0.003 6 | 0.008 0 | -0.021 1 | 0.001 4 | -0.014 9 | -0.000 4 | -0.000 9 |
| 2019 | -0.012 8 | 0.008 4 | 0.020 6 | -0.024 5 | 0.001 0 | -0.006 0 | -0.000 1 | -0.001 7 |
| 2020 | 0.011 7 | -0.042 0 | 0.0158 | -0.045 9 | 0.001 8 | -0.032 7 | -0.000 2 | 0.000 0 |
| 2021 | 0.038 3 | -0.015 1 | 0.055 6 | -0.031 4 | 0.000 2 | 0.023 2 | -0.002 6 | -0.000 7 |
| 2022 | 0.005 6 | -0.000 1 | 0.013 0 | -0.007 2 | -0.000 2 | 0.005 8 | -0.000 1 | -0.000 1 |
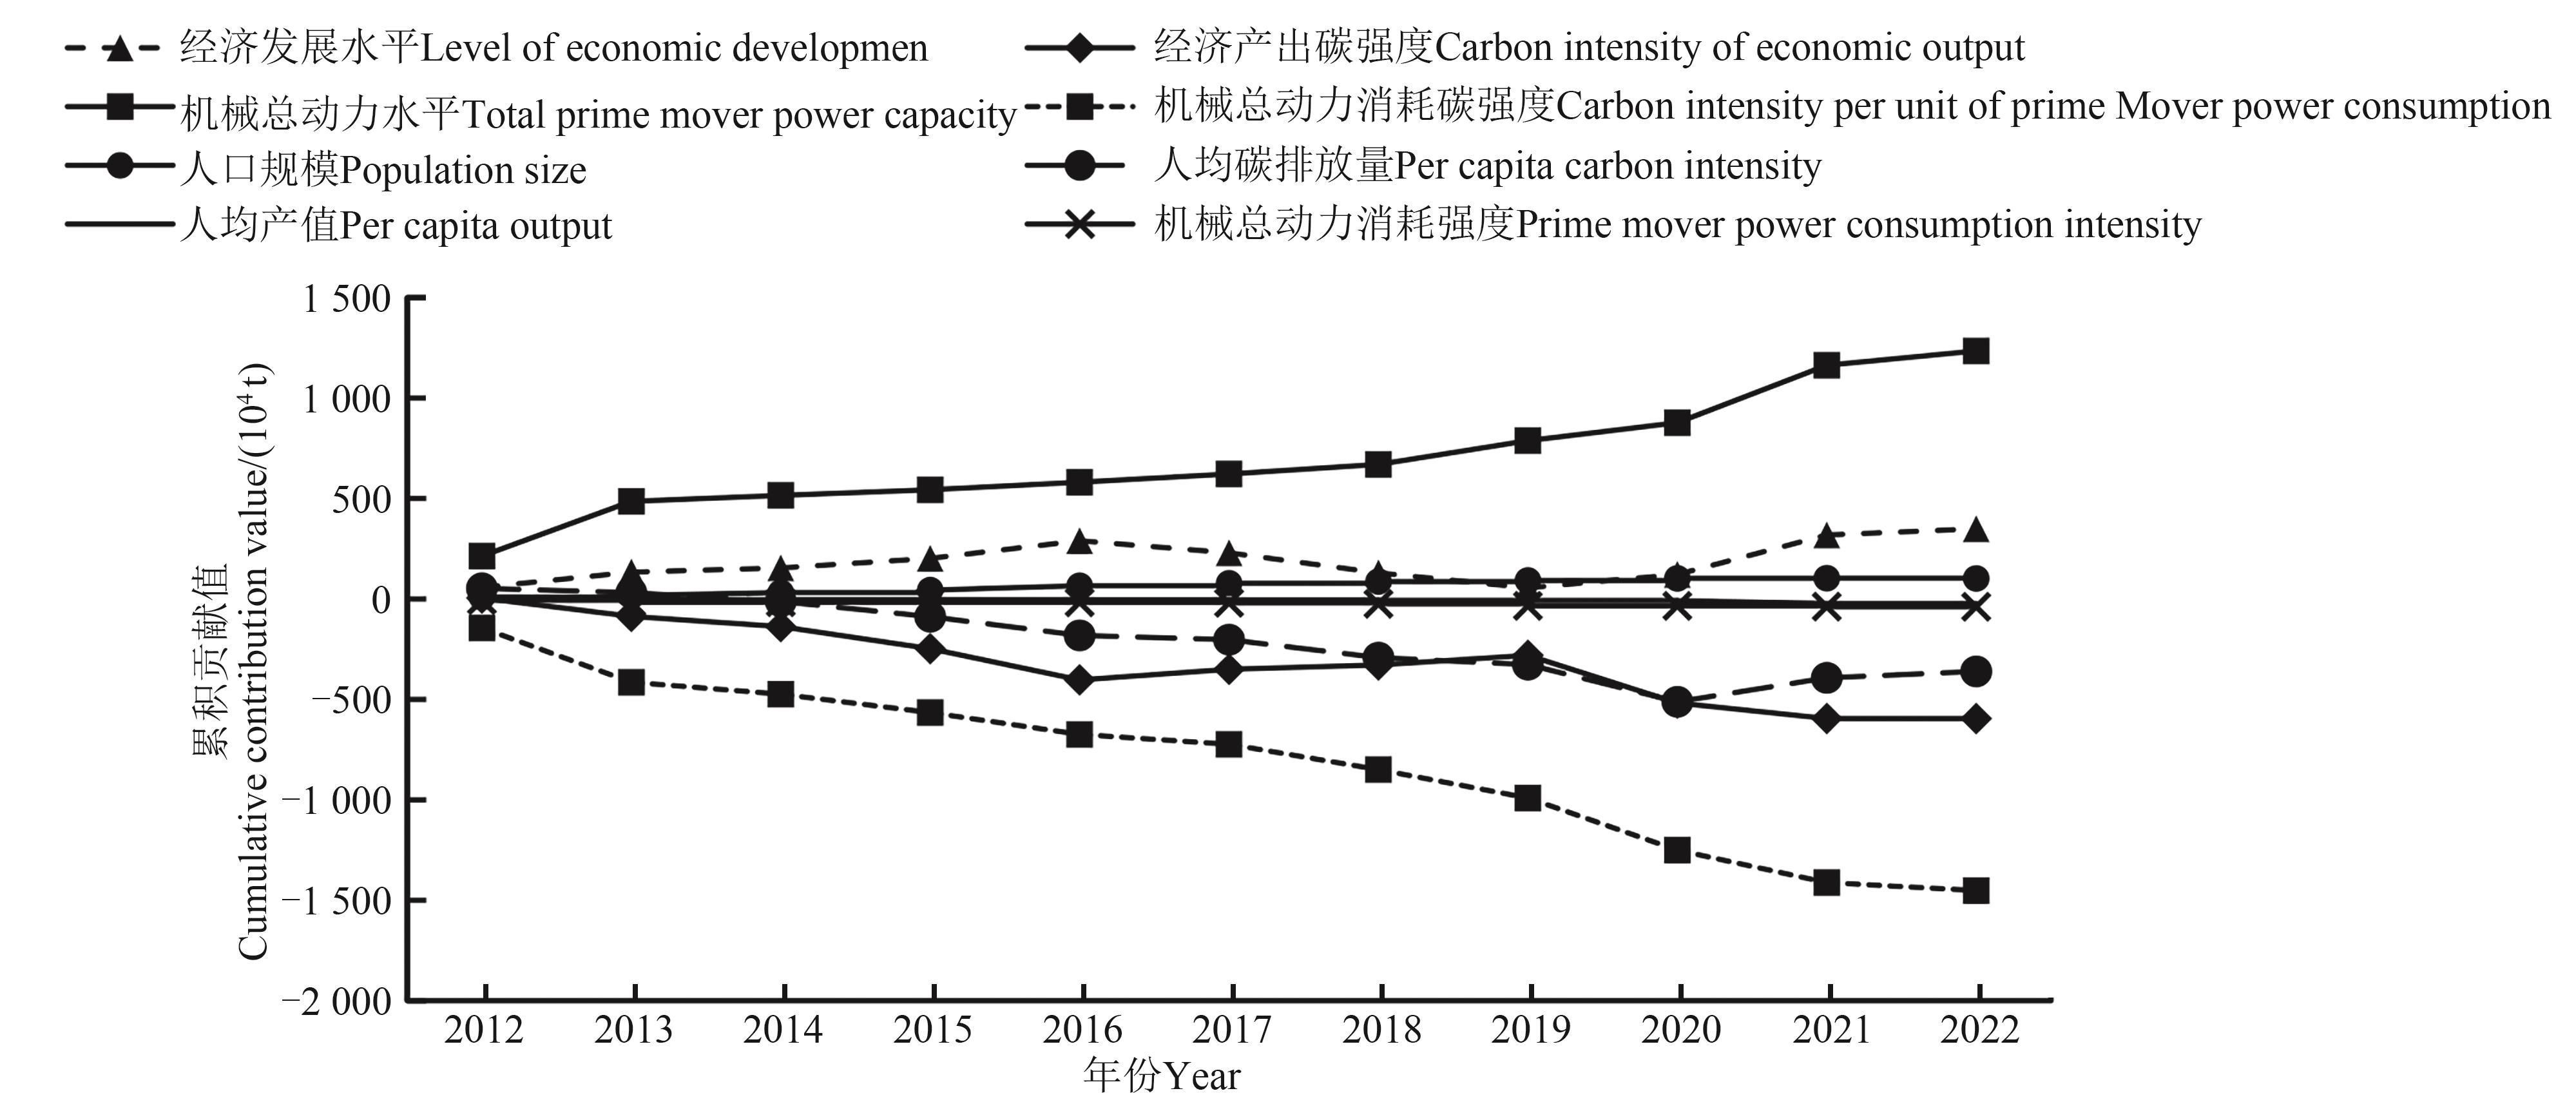
图6 2012—2022年山东省碳排放影响因素的累积贡献值注: 累积贡献值以2011年为基期,将各因素对山东省畜牧业碳排放的贡献值逐年累加。
Fig. 6 Cumulative contribution values of the factors affecting carbon emissions in Shandong Province from 2012 to 2022Note: The cumulative contribution value is based on 2011, and the contribution value of each factor to the carbon emission of animal husbandry in Shandong province is added up year by year.
| [1] | SUBSCRIBE H, CONTACT A, FOCUS T, et al.. Growing greenhouse gas emissions due to meat production [J]. Environ. Dev., 2013, 5: 156-163. |
| [2] | GERBER P J, STEINFELD H, HENDERSON B, et al.. Tackling Climate Change Through Livestock——A Global Assessment of Emissions and Mitigation Opportunities [M]. Rome: FAO, 2013:1-256. |
| [3] | 中华人民共和国国家统计局.中国统计年鉴2022 [M].北京:中国统计出版社, 2022: 1-936. |
| [4] | LIU G, MÜLLER D B. Addressing sustainability in the aluminum industry: a critical review of life cycle assessments [J]. J. Clean. Prod., 2012, 35: 108-117. |
| [5] | 马于清,曹丁戈,罗文海,等.基于生命周期的我国畜禽养殖业碳排放核算[J].中国环境科学, 2024, 44(5): 2799-2810. |
| MA Y Q, CAO D G, LUO W H, et al.. The evaluation of the livestock and poultry production of carbon emissions in China based on life cycle assessment [J]. China Environ. Sci., 2024, 44(5): 2799-2810. | |
| [6] | AKIFUMI O, KAZATO O, AKIRA S, et al.. Life cycle assessment of sustainable broiler production systems: effects of low-protein diet and litter incineration [J/OL]. Agriculture, 2021, 11(10): 921 [2024-09-20]. . |
| [7] | ROSEN R A. Is the ipcc’s 5THASSESSMENT a denier of possible macroeconomic benefits from mitigating climate change? [J/OL]. Clim. Change Econ., 2016, 7(1): 1640003 [2024-09-20]. . |
| [8] | 梁耀文,王明利.中国生猪产业碳排放经验解构与动态达峰路径选择[J].农业经济问题, 2023, 44(10): 101-115. |
| LIANG Y W, WANG M L. Deconstructing the experience of China’s pig industry carbon emissions and choosing a dynamic path to peak [J]. Issu. Agric. Econ., 2023, 44(10): 101-115. | |
| [9] | LESSCHEN J P, VAN DEN BERG M, WESTHOEK H J, et al.. Greenhouse gas emission profiles of European livestock sectors [J]. Anim. Feed. Sci. Technol., 2011, 166: 16-28. |
| [10] | HENDERSON B, GODDE C, MEDINA-HIDALGO D, et al.. Closing system-wide yield gaps to increase food production and mitigate GHGs among mixed crop-livestock smallholders in Sub-Saharan Africa [J]. Agric. Syst., 2016, 143: 106-113. |
| [11] | 熊学振,韩振,孙雨萌,等.中国畜产品进口格局及其资源环境效应研究[J].自然资源学报, 2023, 38(5): 1378-1392. |
| XIONG X Z, HAN Z, SUN Y M, et al.. Study of China's animal products import pattern and its resource and environmental effects [J]. J. Nat. Resour., 2023, 38(5): 1378-1392 | |
| [12] | LI S, QIN Y, SUBBIAH J, et al.. Life cycle assessment of the U.S. beef processing through integrated hybrid approach [J/OL]. J. Clean. Prod., 2020, 265: 121813 [2024-09-20]. . |
| [13] | 胡向东,王济民.中国畜禽温室气体排放量估算[J].农业工程学报, 2010, 26(10): 247-252. |
| HU X D, WANG J M. Estimation of livestock greenhouse gases discharge in China [J]. Trans. Chin. Soc. Agric. Eng., 2010, 26(10): 247-252. | |
| [14] | 吴强,张园园,张明月.中国畜牧业碳排放的量化评估、时空特征及动态演化:2001—2020[J].干旱区资源与环境, 2022, 36(6): 65-71. |
| WU Q, ZHANG Y Y, ZHANG M Y. Quantitative assessment, temporal and spatial characteristics and dynamic evolution of China’s animal husbandry carbon emissions [J]. J. Arid Land Resour. Environ., 2022, 36(6): 65-71. | |
| [15] | 孟祥海,程国强,张俊飚,等.中国畜牧业全生命周期温室气体排放时空特征分析[J].中国环境科学, 2014,3 4(8): 2167-2176. |
| MENG X H, CHENG G Q, ZHANG J B, et al.. Analyze on the spatialtemporal characteristics of GHG estimation of livestock's by life cycle assessment in China [J]. China Environ. Sci., 2014, 34(8): 2167-2176. | |
| [16] | 姚成胜,钱双双,李政通,等.中国省际畜牧业碳排放测度及时空演化机制[J].资源科学, 2017, 39(4): 698-712. |
| YAO C S, QIAN S S, LI Z T, et al.. Provincial animal husbandry carbon emissions in China and temporal-spatial evolution mechanism [J]. Resour. Sci., 2017, 39(4): 698-712. | |
| [17] | 戴小文,李金花,何艳秋,等.2000—2020年中国畜牧业区域碳排放公平性与排放效率[J].资源科学, 2023, 45(1): 62-76. |
| DAI X W, LI J H, HE Y Q, et al.. Regional equity and efficiency of carbon emissions of China's livestock industry in 2000—2020 [J]. Resour. Sci., 2023, 45 (1): 62-76. | |
| [18] | 何小田.山东省农业碳排放时空特征及趋势预测[J].黑龙江粮食, 2023(8): 124-126. |
| [19] | 曹海琳.山东省畜牧业碳排放测算及影响因素研究[D].长春:吉林农业大学,2023. |
| [20] | 陈苏,胡浩.中国畜禽温室气体排放时空变化及影响因素研究[J].中国人口·资源与环境, 2016, 26(7): 93-100. |
| CHEN S, HU H. Study on the spatial-temporal changes and influence factors of greenhouse gases emission from livestock and poultry in China [J]. China Popul. Resour. Environ., 2016, 26(7): 93-100. | |
| [21] | 尚莉媛,崔姹,赵慧峰.京津冀畜牧业碳排放效率时空演变特征及影响因素分析[J].中国农业资源与区划, 2023, 44(12): 190-199. |
| SHANG L Y, CUI C, ZHAO H F. Spatial-temporal evolution characteristics and influencing factors of carbon emission efficiency of animal husbandry in Beijing-Tianjin-Hebei region [J]. Chin. J. Agric. Res. Region. Plan., 2023, 44(12):190-199. | |
| [22] | 白雪冰,胡浩,周应恒,等.中国畜牧业碳排放的时空演进及其影响因素分析[J].中国农业大学学报, 2023, 28(9): 260-274. |
| BAI X B, HU H, ZHOU Y H, et al.. Study on space-time evolution and influence factors of carbon emissions in China's animal husbandry [J]. J. China Agric. Univ., 2023, 28(9):260-274. | |
| [23] | HE D, DENG X, WANG X, et al.. Livestock greenhouse gas emission and mitigation potential in China [J/OL]. J. Environ. Manage., 2023, 348: 119494 [2024-09-20]. . |
| [24] | 闫庆友,尹洁婷.基于广义迪氏指数分解法的京津冀地区碳排放因素分解[J].科技管理研究, 2017, 37(19): 239-245. |
| YAN Q Y, YIN J T. Factor decomposition of carbon emissions in Beijing, Tianjin, Hebei: a study based on generalized divisia index method [J]. Sci. Technol. Manage. Res., 2017, 37(19): 239-245. | |
| [25] | VANINSKY A. Factorial decomposition of CO2 emissions: a generalized divisia index approach [J]. Energy Econ., 2014, 45: 389-400. |
| [26] | 邵帅, 张曦, 赵兴荣.中国制造业碳排放的经验分解与达峰路径:广义迪氏指数分解和动态情景分析[J].中国工业经济,2017(3): 44-63. |
| SHAO S, ZHANG X, ZHAO X R. Empirical decomposition and peaking pathway of carbon dioxide emissions of China's manufacturing sector: generalized divisia index method and dynamic scenario analysis [J]. China Ind. Econ., 2017(3): 44-63. | |
| [27] | 谢鸿宇,陈贤生,杨木壮,等.中国单位畜牧产品生态足迹分析[J].生态学报, 2009, 29(6): 3264-3270. |
| XIE H Y, CHEN X S, YANG M Z, et al.. The ecological footprint analysis of 1kg livestock product of China [J]. Acta Ecol. Sin., 2009, 29(6): 3264-3270. | |
| [28] | 陈胜涛,张开华,张岳武.农业碳排放绩效的测量与脱钩效应[J].统计与决策, 2021, 37(22): 85-88. |
| [29] | 全国温室气体自愿减排注册登记系统及信息平台.2021年度减排项目中国区域电网基准线排放因子[EB/OL].(2023-11-17)[2024-09-20].. |
| [30] | GARNIER J, LE NOË J, MARESCAUX A, et al.. Long-term changes in greenhouse gas emissions from French agriculture and livestock (1852—2014): from traditional agriculture to conventional intensive systems [J]. Sci. Total Environ., 2019, 660: 1486-1501. |
| [31] | 胡川,韦院英,胡威.农业政策、技术创新与农业碳排放的关系研究[J].农业经济问题, 2018, 39(9): 66-75. |
| HU C, WEI Y Y, HU W. Research on the relationship between agricultural policy, technological innovation and agricultural carbon emissions [J]. Issues Agric. Econ., 2018, 39(9): 66-75. | |
| [32] | 汪开英,李鑫,陆建定,等.碳中和目标下畜牧业低碳发展路径[J].农业工程学报, 2022, 38(1): 230-238. |
| WANG K Y, LI X, LU J D, et al.. Low-carbon development strategies of livestock industry to achieve goal of carbon neutrality in China [J]. Trans. Chin. Soc. Agric. Eng., 2022, 38(1): 230-238. | |
| [33] | 励汀郁,王明利.畜牧业助力"双碳"目标实现路径研究:基于不同国家的经验比较与启示[J].世界农业, 2023(1): 5-16. |
| LI T Y, WANG M L. Research on the realization path of carbon peaking and carbon neutrality goals assisted by animal husbandry: based on the experience comparison and enlightenment of different countries [J]. World Agric., 2023(1): 5-16. | |
| [34] | 辛翔飞,王潇,王济民.肉鸡产业高质量发展:问题挑战、趋势研判及政策建议[J].中国家禽, 2024, 46(1): 1-10. |
| XIN X F, WANG X, WANG J M. High-quality development of broiler industry: challenges, trend and policy [J]. China Poult., 2024, 46(1): 1-10. | |
| [35] | 农业农村部,财政部. 2024—2026 年农机购置与应用补贴实施意见[EB/OL]. (2024-04-22)[2024-09-20].. |
| [1] | 王伟明, 潘欣, 孔德平, 安宇, 郭爽, 孙志梅, 薛澄, 孙荣军, 马文奇, 许华森. 我国作物多性化时空变化特征及影响因素[J]. 中国农业科技导报, 2025, 27(6): 16-27. |
| [2] | 杨帆, 林青宁, 王琦, 毛世平. 元宇宙视域下畜牧业智能化路径探索[J]. 中国农业科技导报, 2024, 26(8): 1-8. |
| [3] | 石自忠, 胡向东. 加快建设畜牧强国的理论逻辑与战略路径[J]. 中国农业科技导报, 2023, 25(9): 1-12. |
| [4] | 关洪军, 陈玉环, 赵爱武. 中国海洋渔业碳中和能力评估[J]. 中国农业科技导报, 2023, 25(4): 215-224. |
| [5] | 张朝辉, 姬一帆, 何泽军. 中国省域畜牧业绿色发展竞争力时空演变特征[J]. 中国农业科技导报, 2022, 24(9): 12-23. |
| [6] | 熊学振, 杨春, 马晓萍. 我国畜牧业发展现状与高质量发展策略选择[J]. 中国农业科技导报, 2022, 24(3): 1-10. |
| [7] | 李雪, 刘子飞, 赵明军, 徐乐俊, 孙慧武. 我国水产养殖与捕捞业“双碳”目标及实现路径[J]. 中国农业科技导报, 2022, 24(11): 13-26. |
| [8] | 汤小朋,陈磊,熊康宁*. 有效微生物菌群在贵州喀斯特地区农业生产中的应用前景展望[J]. 中国农业科技导报, 2020, 22(4): 129-138. |
| [9] | 岳冬冬1,王鲁民1*,方海1,耿瑞2,赵鹏飞2,熊敏思1,. 基于碳平衡的中国海洋渔业产业发展对策探析[J]. 中国农业科技导报, 2016, 18(4): 1-8. |
| [10] | 王兴,薛建福,王钰乔,李可嘉,赵鑫,张海林*. 我国西部地区种植业碳收支分析[J]. 中国农业科技导报, 2016, 18(3): 104-111. |
| [11] | 陈会萍,张艳荣*,黄炳凯. 基于协整分析的草食畜牧业竞争力影响因素实证研究 ——以甘肃省为例[J]. 中国农业科技导报, 2016, 18(2): 192-199. |
| [12] | 张英俊1,任继周2,王明利3,杨高文1. 论牧草产业在我国农业产业结构中的地位和发展布局[J]. , 2013, 15(4): 61-71. |
| [13] | 阿拉木斯,吴洪新,夏明. 浅谈草产品安全及其影响因素[J]. , 2009, 11(S1): 82-86. |
| [14] | 浦华,郑彦,王济民. 我国畜牧业生产现状与发展建议[J]. , 2008, 10(1): 63-66. |
| [15] | 顾宪红. 实行畜禽福利饲养是有机畜牧业的基本要求[J]. , 2007, 9(5): 63-67. |
| 阅读次数 | ||||||
|
全文 |
|
|||||
|
摘要 |
|
|||||
 京公网安备11010802021197号