


中国农业科技导报 ›› 2024, Vol. 26 ›› Issue (6): 91-101.DOI: 10.13304/j.nykjdb.2022.0912
蒋沛含1( ), 杨晓楠2, 杨晨旭1, 张爱军2,3()
收稿日期:2022-10-26
接受日期:2023-01-06
出版日期:2024-06-15
发布日期:2024-06-12
通讯作者:
张爱军
作者简介:蒋沛含E-mail:875604794@qq.com;
基金资助:
Peihan JIANG1(), Xiaonan YANG2, Chenxu YANG1, Aijun ZHANG2,3()
Received:2022-10-26
Accepted:2023-01-06
Online:2024-06-15
Published:2024-06-12
Contact:
Aijun ZHANG
摘要:
为构建多品种谷子冠层氮素含量的高光谱监测模型,通过设置不同氮素水平和多品种谷子田间试验,分别获取谷子全生育期冠层高光谱反射率和叶片氮素含量,采用卷积平滑、一阶导数变换对光谱曲线进行预处理,利用光谱数据与氮素含量相关性分析、连续投影算法(successive projections algorithm, SPA)筛选出谷子各生育期和全生育期的氮素敏感波段、植被指数、高光谱特征参数,利用三者组合建立谷子冠层氮素含量的偏最小二乘回归(partial least square regression,PLSR)估测模型,并筛选各生育期最优模型。结果表明,不同生育期最优估测模型有所差异,拔节期基于敏感波段、植被指数、高光谱特征参数的模型精度最高;抽穗期基于敏感波段、植被指数的模型精度最高;灌浆期基于植被指数、高光谱特征参数的模型精度最高;成熟期基于敏感波段、植被指数的模型精度最高;全生育期基于敏感波段与植被指数的模型精度最高(R2=0.903,RPD=3.01)。多输入级综合模型可以充分利用光谱信息,有效提高模型预测精度和稳定性,其中基于敏感波段和植被指数的综合模型表现效果最好,预测集R2均在0.82以上、均方根误差均小于0.119、相对分析误差均大于2.1。以上研究结果为高光谱遥感诊断谷子全生育期氮素盈缺状况与施肥决策提供了理论依据和技术支撑。
中图分类号:
蒋沛含, 杨晓楠, 杨晨旭, 张爱军. 基于偏最小二乘回归的谷子冠层氮素含量高光谱估测研究[J]. 中国农业科技导报, 2024, 26(6): 91-101.
Peihan JIANG, Xiaonan YANG, Chenxu YANG, Aijun ZHANG. Estimation of Nitrogen Content in Millet Canopy Based on Multi Parameter Partial Least Squares Model[J]. Journal of Agricultural Science and Technology, 2024, 26(6): 91-101.
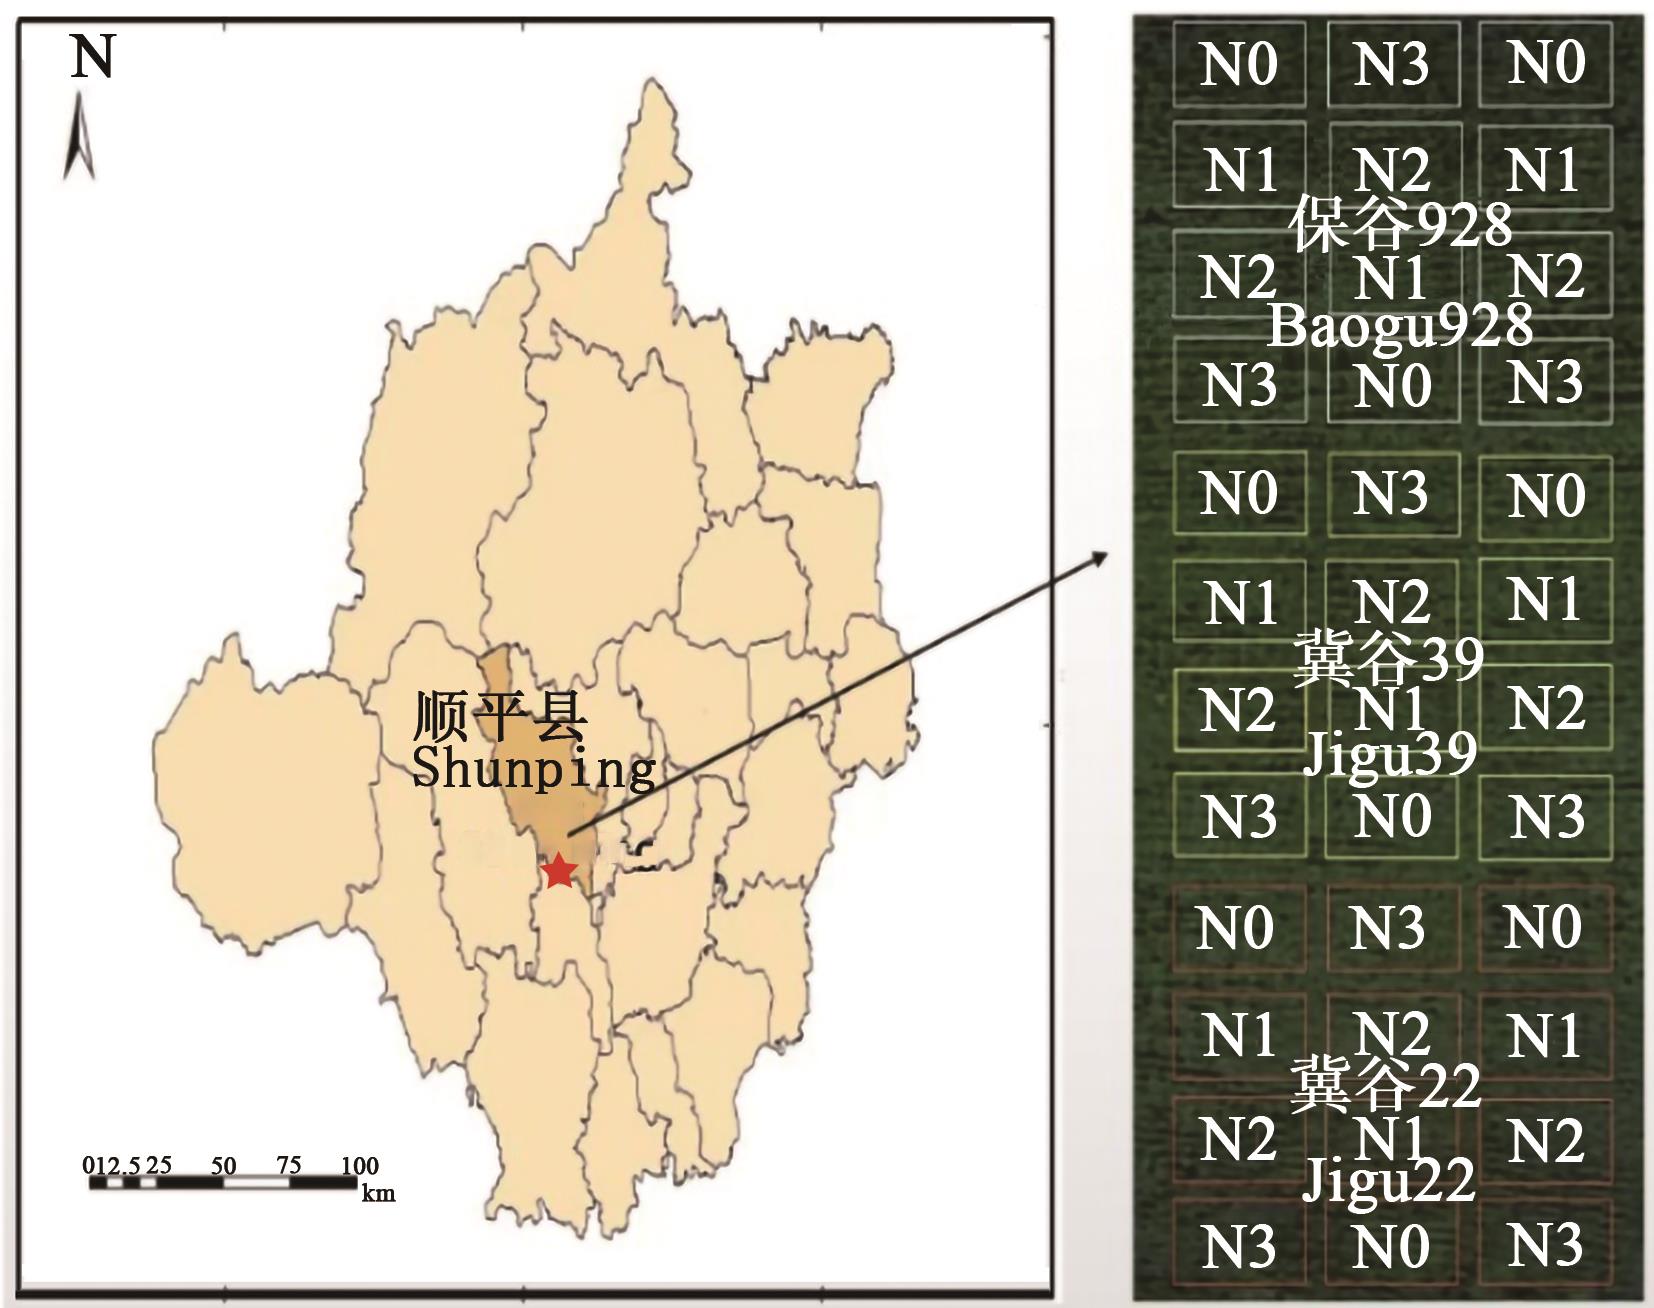
图1 研究区位置和采样分布
Fig. 1 Location of study and distribution of sampling plots
| 参数 Parameter | 变量参数 Variable parameter | 计算公式 Calculation formula |
|---|---|---|
植被指数 Vegetation index | 红边归一化植被指数 Red edge normalized difference spectral (RENDVI) | (R750-R705)/(R750+R705) |
归一化植被指数 Normalized difference spectral (NDVI) | (R800-R670)/(R800+R670) | |
绿色归一化植被指数 Green normalized difference spectral (GNDVI) | (R801-R550)/(R801+R550) | |
比值指数 Ratio spectral index (RSI) | R800/R550 | |
差值指数 Difference spectral index (DSI) | R800-R550 | |
绿度指数 Green index (GVI) | 3[(R700-R670)-0.2(R700-R550)(R700/R670)] | |
修改叶绿素吸收反射指数 Modified chlorophyll absorption reflex index (MCARI) | [(R700-R670)-0.2(R700-R550)](R700/R670) | |
红边优化指数 Optimize red edge index (OREI) | R740-R720 | |
双峰冠层氮素指数 Double canopy nitrogen index (DCNI) | (R800-R680)/(R800+R680) | |
陆地叶绿素指数 Terrestrial chlorophyll index (MTCI) | (R800-R635)/(R800+R635) | |
叶绿素吸收反射率指数 Transformed chlorophyll absorption in reflectance index (TCARI) | 3[(R700-R670)-0.2(R700-R550)(R700/R670)] | |
叶绿素吸收比值指数 Chlorophyll absorption in reflectance index (CARI) | (R700-R670)-0.2(R700+R670) | |
光化学植被指数 Photochemistry reflectance index (PRI) | (R570-R531)/(R570+R531) |
表 1 常见氮素植被指数与高光谱特征参数
Table 1 Common nitrogen vegetation index and hyperspectral characteristic parameters
| 参数 Parameter | 变量参数 Variable parameter | 计算公式 Calculation formula |
|---|---|---|
植被指数 Vegetation index | 红边归一化植被指数 Red edge normalized difference spectral (RENDVI) | (R750-R705)/(R750+R705) |
归一化植被指数 Normalized difference spectral (NDVI) | (R800-R670)/(R800+R670) | |
绿色归一化植被指数 Green normalized difference spectral (GNDVI) | (R801-R550)/(R801+R550) | |
比值指数 Ratio spectral index (RSI) | R800/R550 | |
差值指数 Difference spectral index (DSI) | R800-R550 | |
绿度指数 Green index (GVI) | 3[(R700-R670)-0.2(R700-R550)(R700/R670)] | |
修改叶绿素吸收反射指数 Modified chlorophyll absorption reflex index (MCARI) | [(R700-R670)-0.2(R700-R550)](R700/R670) | |
红边优化指数 Optimize red edge index (OREI) | R740-R720 | |
双峰冠层氮素指数 Double canopy nitrogen index (DCNI) | (R800-R680)/(R800+R680) | |
陆地叶绿素指数 Terrestrial chlorophyll index (MTCI) | (R800-R635)/(R800+R635) | |
叶绿素吸收反射率指数 Transformed chlorophyll absorption in reflectance index (TCARI) | 3[(R700-R670)-0.2(R700-R550)(R700/R670)] | |
叶绿素吸收比值指数 Chlorophyll absorption in reflectance index (CARI) | (R700-R670)-0.2(R700+R670) | |
光化学植被指数 Photochemistry reflectance index (PRI) | (R570-R531)/(R570+R531) |
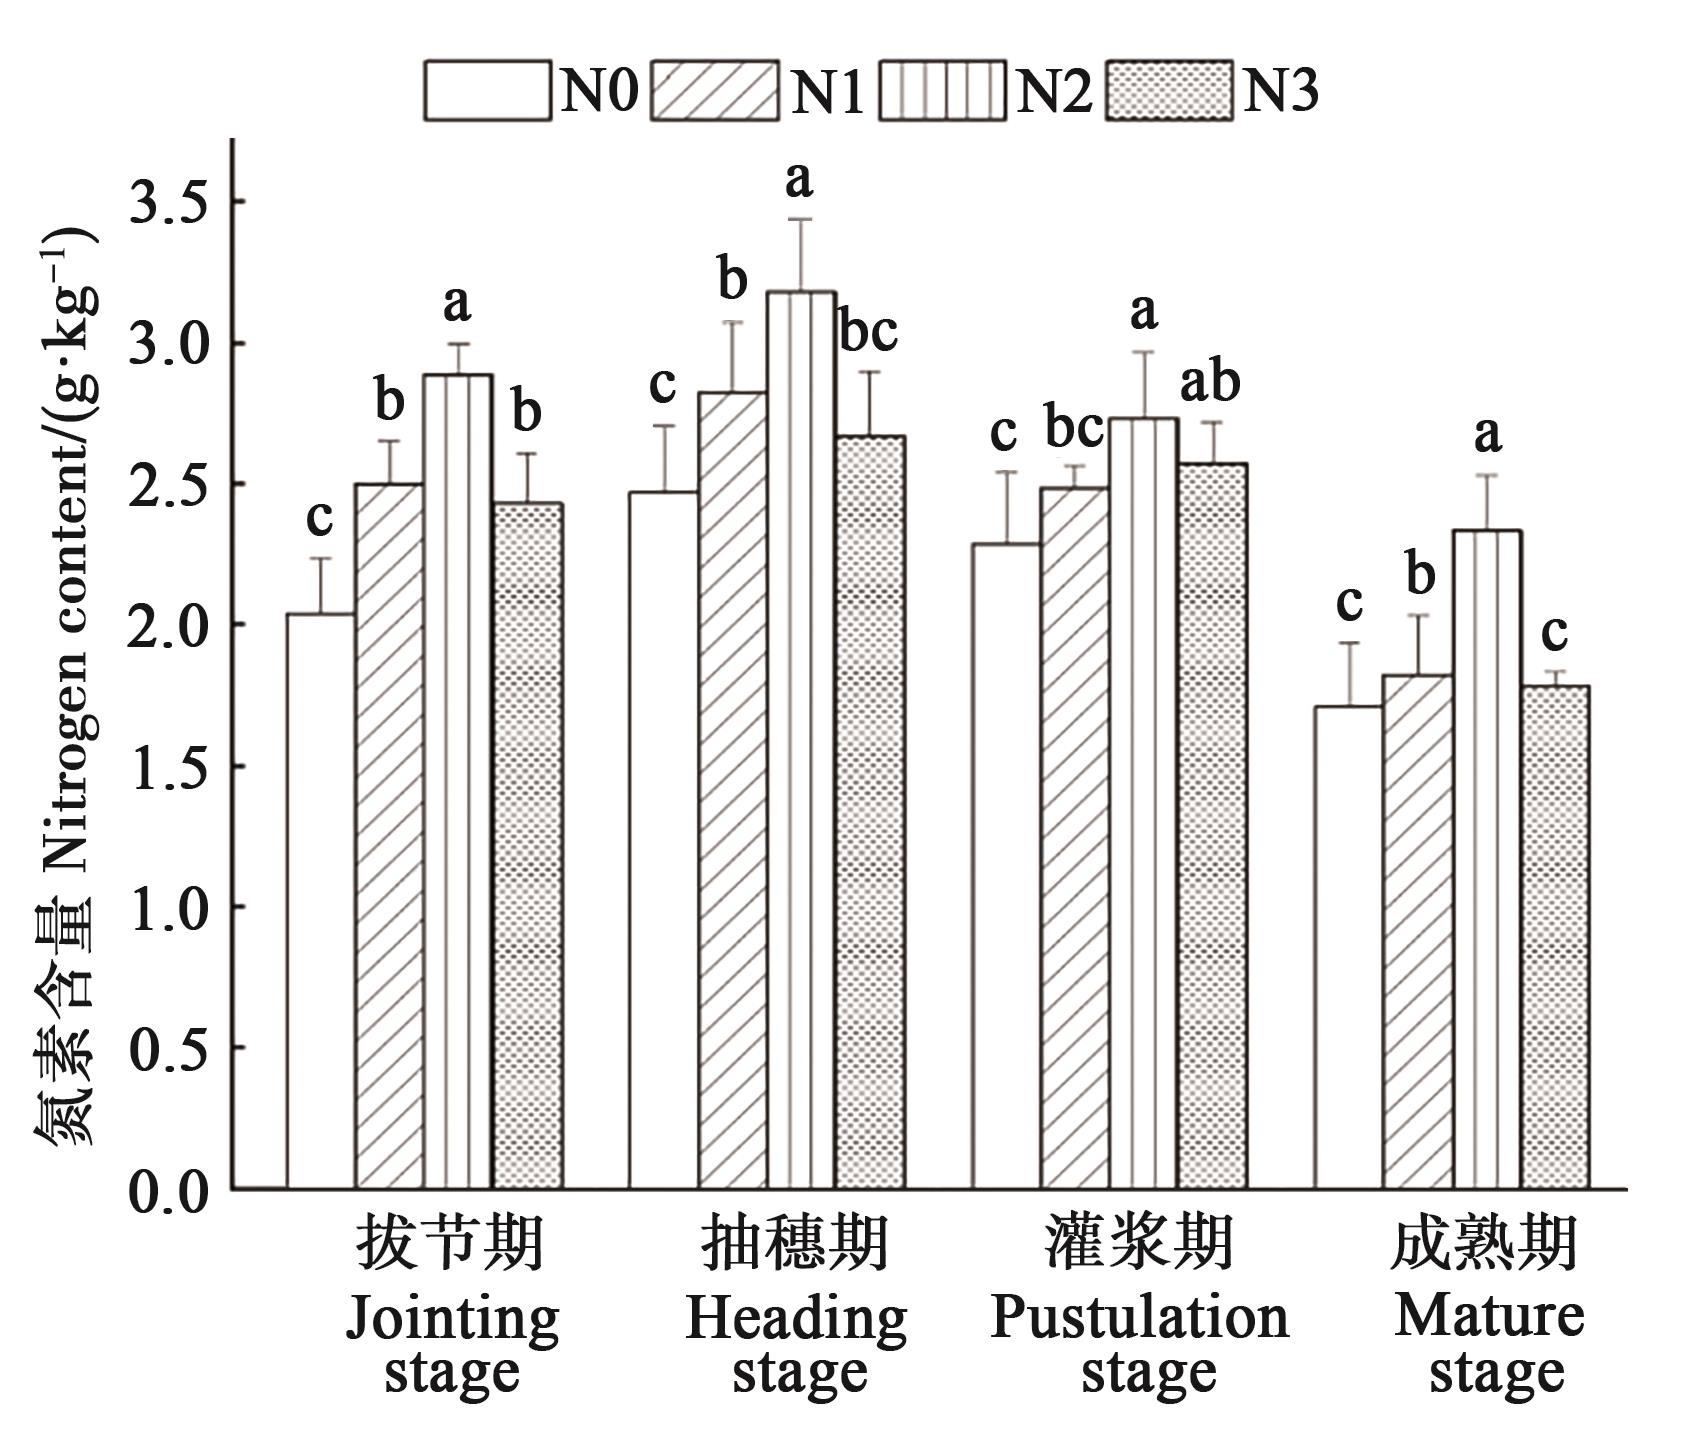
图2 各生育期不同氮处理下谷子冠层氮素含量注:不同小写字母表示同一时期不同处理间在P<0.05水平差异显著。
Fig. 2 Nitrogen content in millet canopy under different nitrogen treatments at each growth stageDifferent lowercase letters indicate significant differences between different treatments in same stage at P<0.05 level.
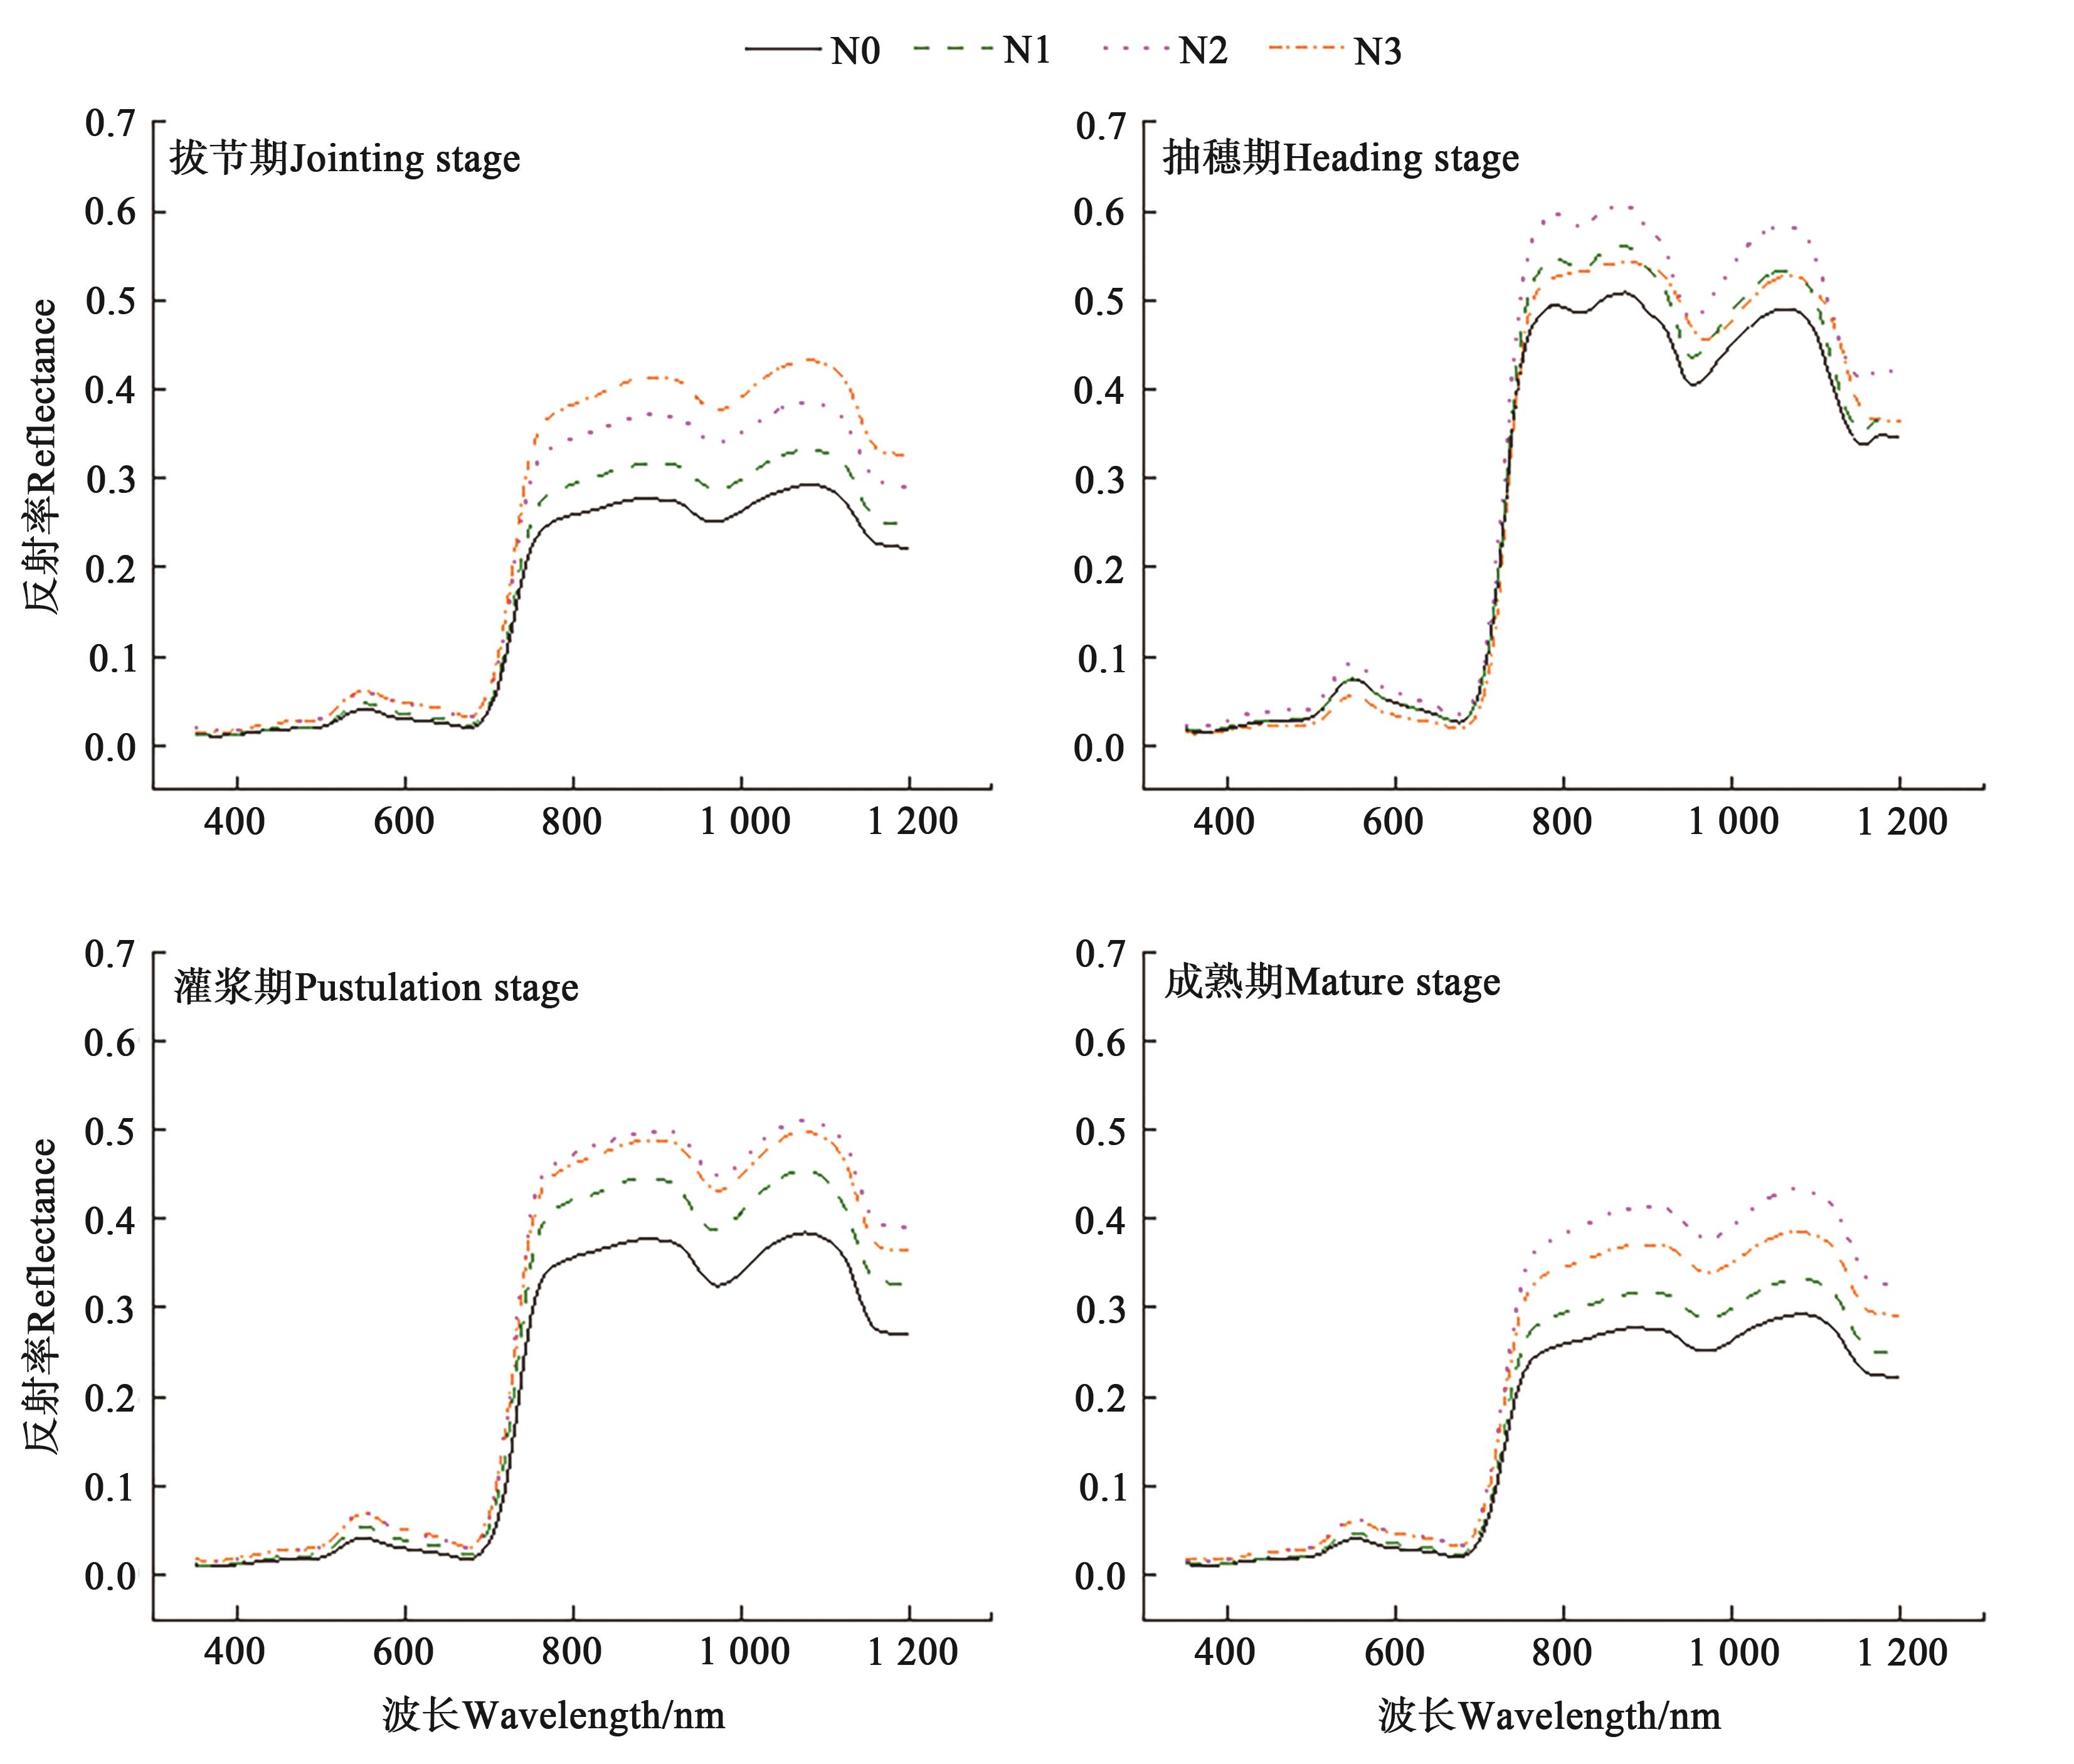
图3 不同施氮水平谷子冠层光谱反射特征
Fig. 3 Spectral reflectance characteristics of millet canopy at different nitrogen application levels
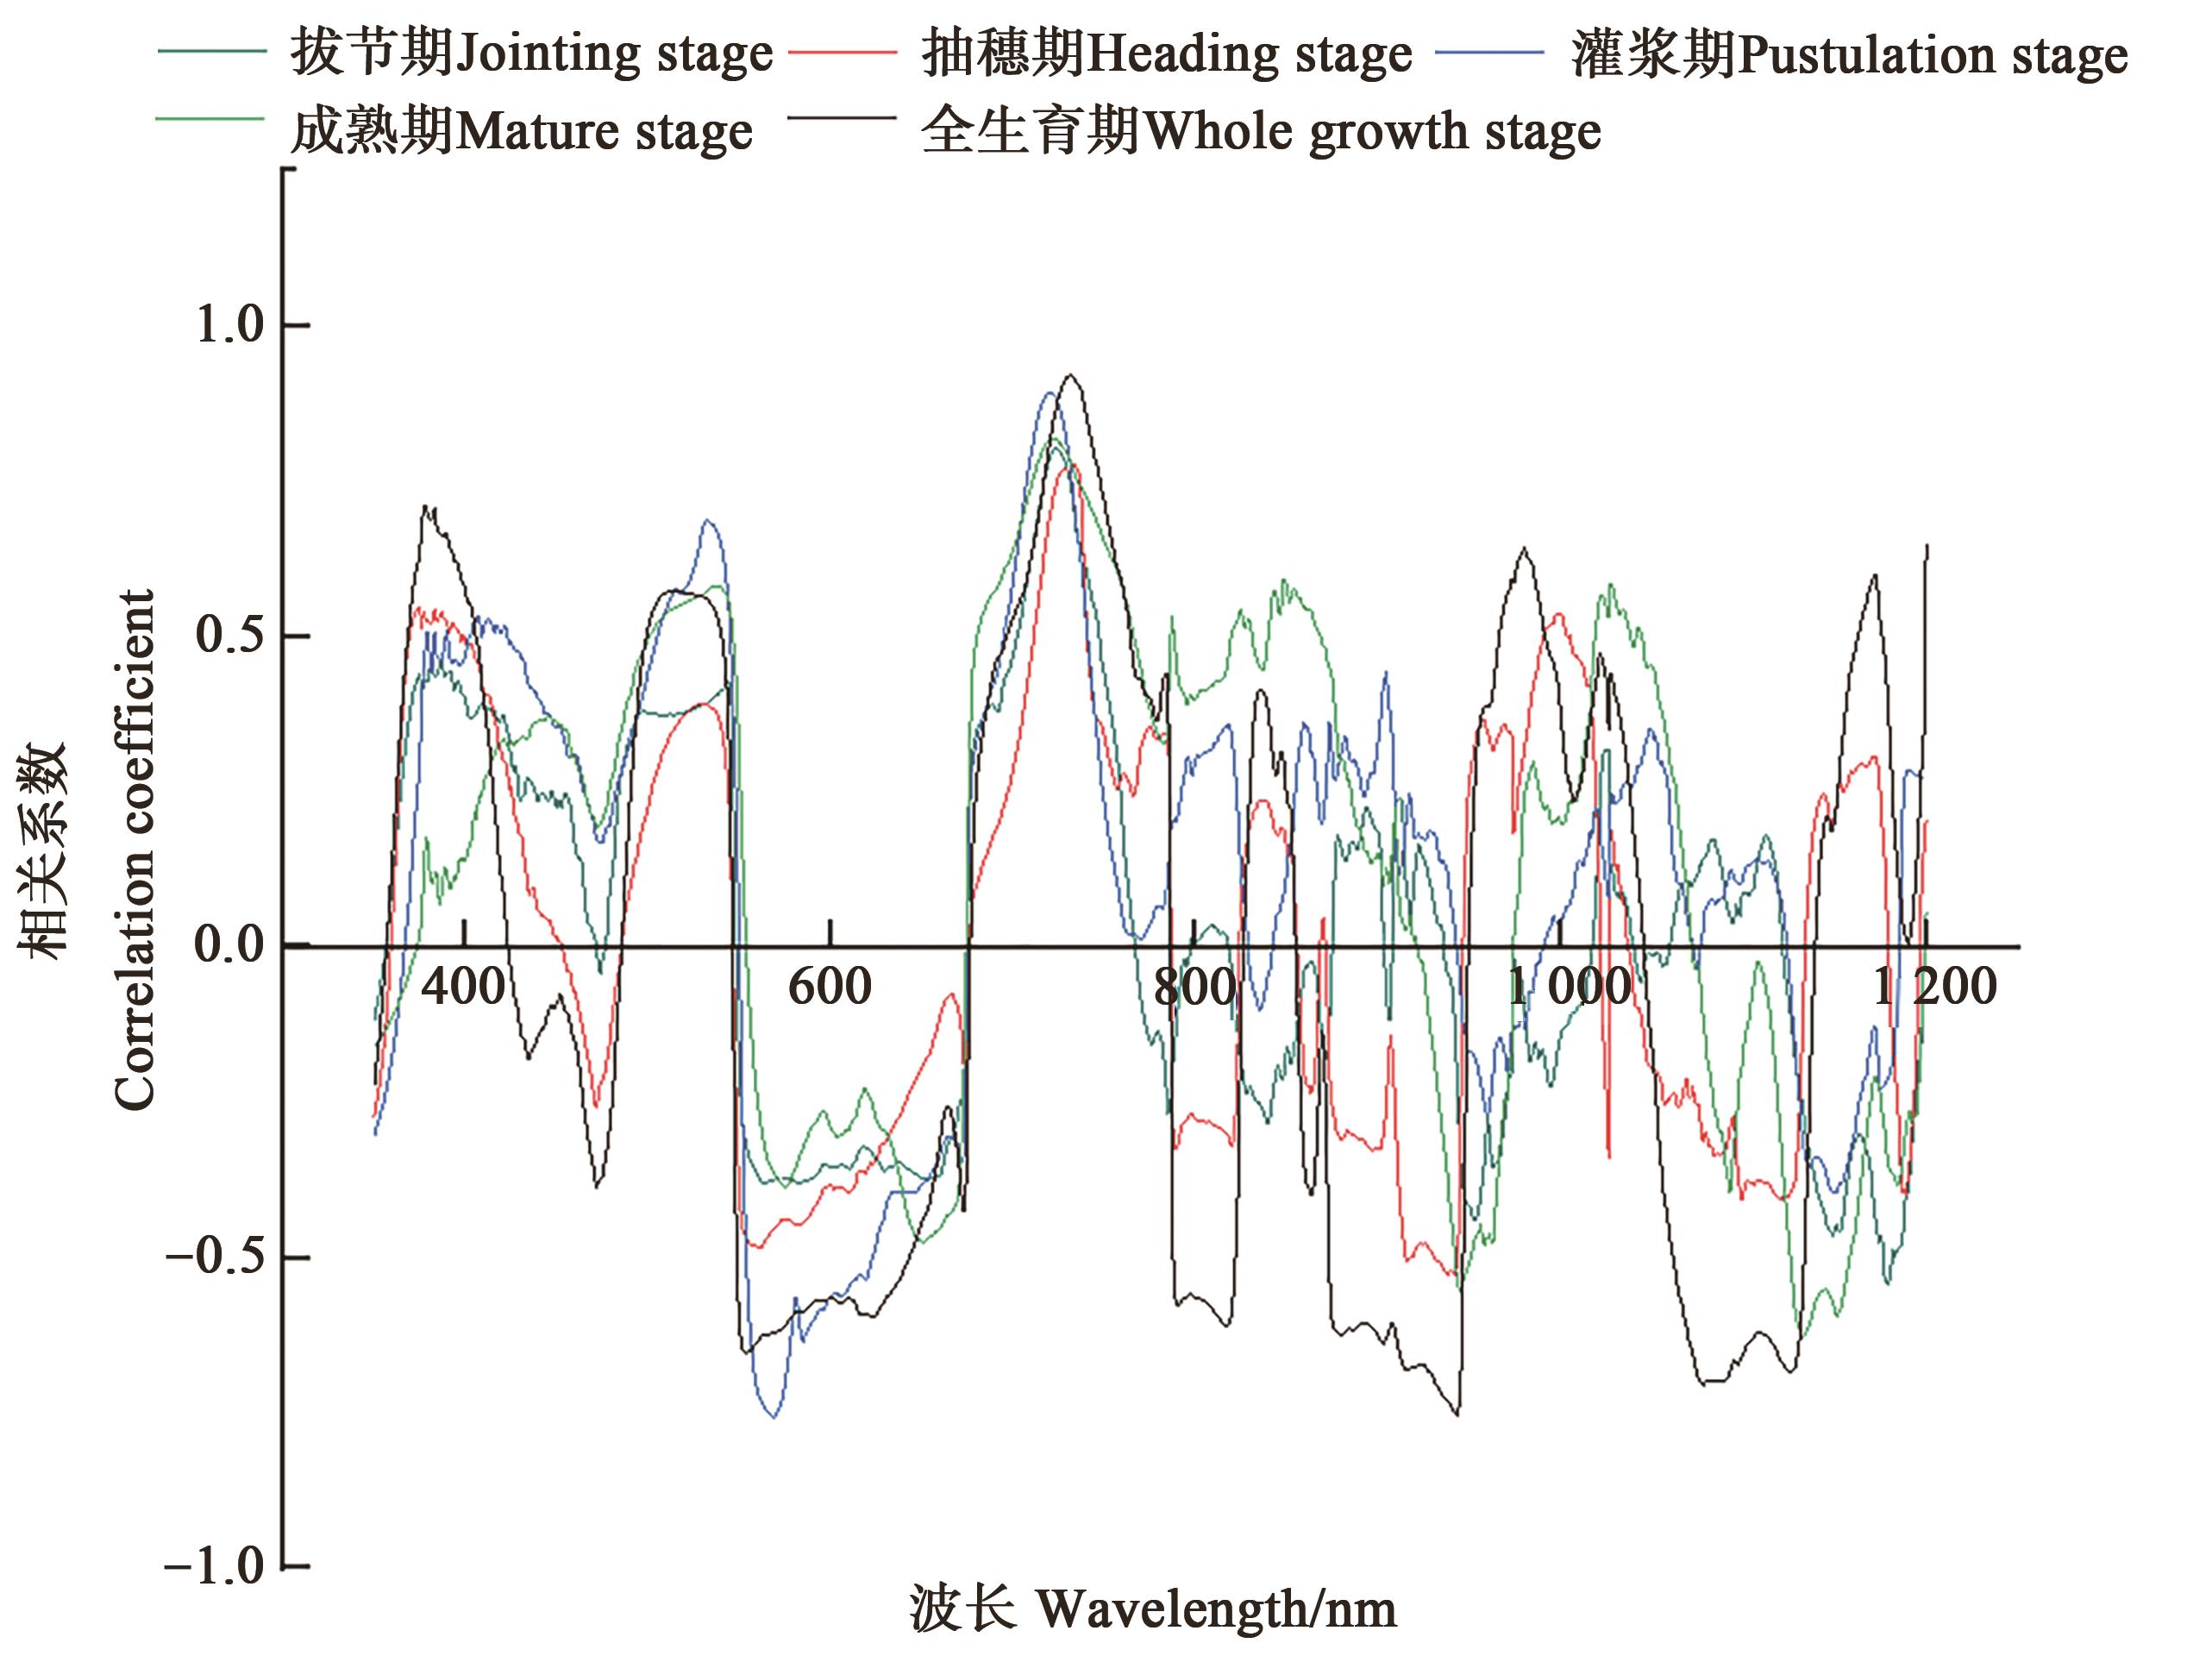
图4 一阶导光谱反射率与氮素含量相关性分析
Fig. 4 Correlation analysis between first-order spectral reflectance and nitrogen content
波段 Band | 拔节期 Jointing stage | 抽穗期 Heading stage | 灌浆期 Pustulation stage | 成熟期 Mature stage | 全生育期 Whole growth stage |
|---|---|---|---|---|---|
| 350~499 | 370, 450 | 351, 355 | 377, 397, 447 | 350, 415, 450 | 395, 410, 430 |
| 500~599 | 550 | — | 550, 560 | 505 | 525, 540 |
| 600~679 | 760 | — | 700 | — | — |
| 680~759 | 660, 730 | 700, 730 | 755 | 740, 795 | 725 |
| 760~1 200 | 780, 900, 1 100 | 920, 970, 1 100 | 870, 945, 1 018 | 820, 1 000 | 876,915, 985, 1 050 |
表2 基于SPA的敏感波段筛选 (nm)
Table 2 Sensitive bands selected by SPA
波段 Band | 拔节期 Jointing stage | 抽穗期 Heading stage | 灌浆期 Pustulation stage | 成熟期 Mature stage | 全生育期 Whole growth stage |
|---|---|---|---|---|---|
| 350~499 | 370, 450 | 351, 355 | 377, 397, 447 | 350, 415, 450 | 395, 410, 430 |
| 500~599 | 550 | — | 550, 560 | 505 | 525, 540 |
| 600~679 | 760 | — | 700 | — | — |
| 680~759 | 660, 730 | 700, 730 | 755 | 740, 795 | 725 |
| 760~1 200 | 780, 900, 1 100 | 920, 970, 1 100 | 870, 945, 1 018 | 820, 1 000 | 876,915, 985, 1 050 |
| 参数 Parameter | 拔节期 Jointing stage | 抽穗期 Heading stage | 灌浆期 Pustulation stage | 成熟期 Mature stage | 全生长期 Whole growth stage | |||||
|---|---|---|---|---|---|---|---|---|---|---|
指数 Index | 相关系数 Correlation coefficient | 指数 Index | 相关系数 Correlation coefficient | 指数 Index | 相关系数 Correlation coefficient | 指数 Index | 相关系数 Correlation coefficient | 指数 Index | 相关系数 Correlation coefficient | |
植被指数 Vegetation index | 差值 指数 DSI | 0.863** | 差值 指数 DSI | 0.743** | 差值 指数 DSI | 0.916** | 差值 指数 DSI | 0.858** | 差值 指数 DSI | 0.926** |
双峰冠层氮素指数 DCNI | 0.783** | 双峰冠层氮素指数 DCNI | 0.421** | 归一化植被 指数 NDVI | -0.609** | 双峰冠层氮素指数 DCNI | 0.841** | 双峰冠层氮素指数 DCNI | 0.828** | |
叶绿素吸收反射率指数 TCARI | 0.402** | 叶绿素吸收反射率指数 TCARI | 0.230** | 比值植被指数 RSI | -0.591** | 叶绿素吸收反射率 指数 TCARI | 0.565** | 修改叶绿素吸收反射率指数 MCARI | 0.747** | |
修改叶绿素吸收反射率指数 MCARI | 0.368** | 修改叶绿素吸收反射率指数 MCARI | 0.200** | 双峰冠层氮素指数 DCNI | 0.577** | 修改叶绿素吸收反射率指数 MCARI | 0.546** | 陆地叶绿素指数 MTCI | 0.575** | |
归一化植被指数 NDVI | -0.230** | 叶绿素吸收反射率 指数 TCARI | 0.554** | 叶绿素吸收反射率指数 TCARI | 0.555** | |||||
高光谱 特征参数 Hyperspectralcharacteristic parameters | 红边位置 SDr | 0.837** | 红边位置SDr | 0.808** | 红边 位置 SDr | 0.935** | 红边 位置 SDr | 0.860** | 红边振幅 Dr | 0.712** |
红边振幅 Dr | 0.806** | 黄边位置SDy | -0.399** | 红边 振幅 Dr | 0.758** | 红边 振幅 Dr | 0.810** | 红边位置/蓝边位置 V13 | -0.651** | |
蓝边振幅 Db | 0.382** | 黄边振幅Dy | -0.348** | 黄边 位置 SDy | -0.645** | 蓝边 振幅 Db | 0.515** | 黄边振幅 Dy | 0.649** | |
蓝边位置 SDb | 0.377** | 蓝边振幅Db | 0.325** | 蓝边 振幅 Db | 0.587** | 蓝边 位置 SDb | 0.507** | 黄边位置SDy | 0.624** | |
| 黄边位置SDy | -0.365** | 蓝边位置SDb | 0.315** | 蓝边 位置SDb | 0.553** | 黄边位置SDy | -0.343 ** | 红边位置 SDr | 0.621** | |
表3 各生育期植被指数以及高光谱特征参数相关性
Table 3 Correlation of vegetation index and hyperspectral characteristic parameters in each growth period
| 参数 Parameter | 拔节期 Jointing stage | 抽穗期 Heading stage | 灌浆期 Pustulation stage | 成熟期 Mature stage | 全生长期 Whole growth stage | |||||
|---|---|---|---|---|---|---|---|---|---|---|
指数 Index | 相关系数 Correlation coefficient | 指数 Index | 相关系数 Correlation coefficient | 指数 Index | 相关系数 Correlation coefficient | 指数 Index | 相关系数 Correlation coefficient | 指数 Index | 相关系数 Correlation coefficient | |
植被指数 Vegetation index | 差值 指数 DSI | 0.863** | 差值 指数 DSI | 0.743** | 差值 指数 DSI | 0.916** | 差值 指数 DSI | 0.858** | 差值 指数 DSI | 0.926** |
双峰冠层氮素指数 DCNI | 0.783** | 双峰冠层氮素指数 DCNI | 0.421** | 归一化植被 指数 NDVI | -0.609** | 双峰冠层氮素指数 DCNI | 0.841** | 双峰冠层氮素指数 DCNI | 0.828** | |
叶绿素吸收反射率指数 TCARI | 0.402** | 叶绿素吸收反射率指数 TCARI | 0.230** | 比值植被指数 RSI | -0.591** | 叶绿素吸收反射率 指数 TCARI | 0.565** | 修改叶绿素吸收反射率指数 MCARI | 0.747** | |
修改叶绿素吸收反射率指数 MCARI | 0.368** | 修改叶绿素吸收反射率指数 MCARI | 0.200** | 双峰冠层氮素指数 DCNI | 0.577** | 修改叶绿素吸收反射率指数 MCARI | 0.546** | 陆地叶绿素指数 MTCI | 0.575** | |
归一化植被指数 NDVI | -0.230** | 叶绿素吸收反射率 指数 TCARI | 0.554** | 叶绿素吸收反射率指数 TCARI | 0.555** | |||||
高光谱 特征参数 Hyperspectralcharacteristic parameters | 红边位置 SDr | 0.837** | 红边位置SDr | 0.808** | 红边 位置 SDr | 0.935** | 红边 位置 SDr | 0.860** | 红边振幅 Dr | 0.712** |
红边振幅 Dr | 0.806** | 黄边位置SDy | -0.399** | 红边 振幅 Dr | 0.758** | 红边 振幅 Dr | 0.810** | 红边位置/蓝边位置 V13 | -0.651** | |
蓝边振幅 Db | 0.382** | 黄边振幅Dy | -0.348** | 黄边 位置 SDy | -0.645** | 蓝边 振幅 Db | 0.515** | 黄边振幅 Dy | 0.649** | |
蓝边位置 SDb | 0.377** | 蓝边振幅Db | 0.325** | 蓝边 振幅 Db | 0.587** | 蓝边 位置 SDb | 0.507** | 黄边位置SDy | 0.624** | |
| 黄边位置SDy | -0.365** | 蓝边位置SDb | 0.315** | 蓝边 位置SDb | 0.553** | 黄边位置SDy | -0.343 ** | 红边位置 SDr | 0.621** | |
| 参数 Parameter | 生育期 Growth stage | 建模集Modeling set | 验证集 Validation set | ||||
|---|---|---|---|---|---|---|---|
| 决定 系数R2 | 均方根误差 RMSE | 相对分析 误差RPD | 决定 系数R2 | 均方根误差 RMSE | 相对分析误差RPD | ||
敏感波段 Sensitive band | 拔节期Jointing stage | 0.943 | 0.095 | 2.338 | 0.668 | 0.153 | 1.733 |
| 抽穗期Heading stage | 0.638 | 0.125 | 1.518 | 0.772 | 0.147 | 1.730 | |
| 灌浆期Pustulation stage | 0.697 | 0.085 | 1.680 | 0.853 | 0.102 | 1.380 | |
| 成熟期Mature stage | 0.884 | 0.107 | 1.780 | 0.686 | 0.180 | 1.484 | |
| 全生育期Whole growth stage | 0.851 | 0.134 | 2.176 | 0.932 | 0.117 | 1.969 | |
植被指数 Vegetation index | 拔节期Jointing stage | 0.810 | 0.120 | 2.197 | 0.876 | 0.094 | 1.820 |
| 抽穗期Heading stage | 0.783 | 0.125 | 2.042 | 0.441 | 0.458 | 1.249 | |
| 灌浆期Pustulation stage | 0.898 | 0.102 | 1.562 | 0.799 | 0.063 | 1.694 | |
| 成熟期Mature stage | 0.800 | 0.122 | 2.133 | 0.924 | 0.094 | 2.395 | |
| 全生育期Whole growth stage | 0.872 | 0.144 | 2.701 | 0.843 | 0.124 | 2.522 | |
高光谱特征参数 Hyperspectral characteristic | 拔节期Jointing stage | 0.749 | 0.113 | 1.884 | 0.848 | 0.100 | 2.314 |
| 抽穗期Heading stage | 0.745 | 0.122 | 1.856 | 0.618 | 0.160 | 1.469 | |
| 灌浆期Pustulation stage | 0.720 | 0.082 | 1.768 | 0.749 | 0.078 | 1.838 | |
| 成熟期Mature stage | 0.737 | 0.135 | 2.039 | 0.649 | 0.112 | 1.771 | |
| 全生育期Whole growth stage | 0.693 | 0.210 | 1.667 | 0.645 | 0.236 | 1.474 | |
敏感波段、植被 指数组合模型 Sensitive band, vegetation index | 拔节期Jointing stage | 0.795 | 0.102 | 2.098 | 0.895 | 0.080 | 2.136 |
| 抽穗期Heading stage | 0.829 | 0.102 | 2.328 | 0.822 | 0.105 | 2.342 | |
| 灌浆期Pustulation stage | 0.715 | 0.083 | 1.743 | 0.848 | 0.061 | 2.497 | |
| 成熟期Mature stage | 0.892 | 0.087 | 2.966 | 0.878 | 0.067 | 2.952 | |
| 全生育期Whole growth stage | 0.878 | 0.134 | 2.778 | 0.903 | 0.119 | 3.010 | |
敏感波段、高光谱特征参数组合模型 Sensitive band, hyperspectral characteristic | 拔节期Jointing stage | 0.878 | 0.081 | 2.787 | 0.867 | 0.085 | 2.660 |
| 抽穗期Heading stage | 0.807 | 0.102 | 2.181 | 0.809 | 0.119 | 2.078 | |
| 灌浆期Pustulation stage | 0.769 | 0.072 | 1.981 | 0.802 | 0.059 | 2.108 | |
| 成熟期Mature stage | 0.773 | 0.122 | 1.995 | 0.815 | 0.090 | 2.440 | |
| 全生育期Whole growth stage | 0.858 | 0.144 | 2.559 | 0.896 | 0.124 | 3.004 | |
植被指数、高光谱特征参数组合模型 Vegetation index,hyperspectral characteristic | 拔节期Jointing stage | 0.765 | 0.160 | 1.945 | 0.684 | 0.191 | 1.646 |
| 抽穗期Heading stage | 0.748 | 0.172 | 0.873 | 0.706 | 0.187 | 1.718 | |
| 灌浆期Pustulation stage | 0.699 | 0.185 | 1.685 | 0.666 | 0.187 | 1.575 | |
| 成熟期Mature stage | 0.792 | 0.185 | 2.087 | 0.721 | 0.206 | 1.807 | |
| 全生育期Whole growth stage | 0.894 | 0.125 | 2.970 | 0.856 | 0.131 | 2.829 | |
| 敏感波段、植被指数、高光谱特征参数组合模型 Sensitive band, vegetation index, hyperspectral characteristic | 拔节期Jointing stage | 0.924 | 0.064 | 2.720 | 0.928 | 0.063 | 2.762 |
| 抽穗期Heading stage | 0.814 | 0.100 | 2.229 | 0.819 | 0.116 | 2.099 | |
| 灌浆期Pustulation stage | 0.763 | 0.080 | 1.935 | 0.793 | 0.063 | 2.019 | |
| 成熟期Mature stage | 0.755 | 0.127 | 1.906 | 0.853 | 0.080 | 2.765 | |
| 全生育期Whole growth stage | 0.875 | 0.135 | 2.742 | 0.906 | 0.118 | 2.949 | |
表4 PLSR模型结果
Table 4 Results of PLSR model
| 参数 Parameter | 生育期 Growth stage | 建模集Modeling set | 验证集 Validation set | ||||
|---|---|---|---|---|---|---|---|
| 决定 系数R2 | 均方根误差 RMSE | 相对分析 误差RPD | 决定 系数R2 | 均方根误差 RMSE | 相对分析误差RPD | ||
敏感波段 Sensitive band | 拔节期Jointing stage | 0.943 | 0.095 | 2.338 | 0.668 | 0.153 | 1.733 |
| 抽穗期Heading stage | 0.638 | 0.125 | 1.518 | 0.772 | 0.147 | 1.730 | |
| 灌浆期Pustulation stage | 0.697 | 0.085 | 1.680 | 0.853 | 0.102 | 1.380 | |
| 成熟期Mature stage | 0.884 | 0.107 | 1.780 | 0.686 | 0.180 | 1.484 | |
| 全生育期Whole growth stage | 0.851 | 0.134 | 2.176 | 0.932 | 0.117 | 1.969 | |
植被指数 Vegetation index | 拔节期Jointing stage | 0.810 | 0.120 | 2.197 | 0.876 | 0.094 | 1.820 |
| 抽穗期Heading stage | 0.783 | 0.125 | 2.042 | 0.441 | 0.458 | 1.249 | |
| 灌浆期Pustulation stage | 0.898 | 0.102 | 1.562 | 0.799 | 0.063 | 1.694 | |
| 成熟期Mature stage | 0.800 | 0.122 | 2.133 | 0.924 | 0.094 | 2.395 | |
| 全生育期Whole growth stage | 0.872 | 0.144 | 2.701 | 0.843 | 0.124 | 2.522 | |
高光谱特征参数 Hyperspectral characteristic | 拔节期Jointing stage | 0.749 | 0.113 | 1.884 | 0.848 | 0.100 | 2.314 |
| 抽穗期Heading stage | 0.745 | 0.122 | 1.856 | 0.618 | 0.160 | 1.469 | |
| 灌浆期Pustulation stage | 0.720 | 0.082 | 1.768 | 0.749 | 0.078 | 1.838 | |
| 成熟期Mature stage | 0.737 | 0.135 | 2.039 | 0.649 | 0.112 | 1.771 | |
| 全生育期Whole growth stage | 0.693 | 0.210 | 1.667 | 0.645 | 0.236 | 1.474 | |
敏感波段、植被 指数组合模型 Sensitive band, vegetation index | 拔节期Jointing stage | 0.795 | 0.102 | 2.098 | 0.895 | 0.080 | 2.136 |
| 抽穗期Heading stage | 0.829 | 0.102 | 2.328 | 0.822 | 0.105 | 2.342 | |
| 灌浆期Pustulation stage | 0.715 | 0.083 | 1.743 | 0.848 | 0.061 | 2.497 | |
| 成熟期Mature stage | 0.892 | 0.087 | 2.966 | 0.878 | 0.067 | 2.952 | |
| 全生育期Whole growth stage | 0.878 | 0.134 | 2.778 | 0.903 | 0.119 | 3.010 | |
敏感波段、高光谱特征参数组合模型 Sensitive band, hyperspectral characteristic | 拔节期Jointing stage | 0.878 | 0.081 | 2.787 | 0.867 | 0.085 | 2.660 |
| 抽穗期Heading stage | 0.807 | 0.102 | 2.181 | 0.809 | 0.119 | 2.078 | |
| 灌浆期Pustulation stage | 0.769 | 0.072 | 1.981 | 0.802 | 0.059 | 2.108 | |
| 成熟期Mature stage | 0.773 | 0.122 | 1.995 | 0.815 | 0.090 | 2.440 | |
| 全生育期Whole growth stage | 0.858 | 0.144 | 2.559 | 0.896 | 0.124 | 3.004 | |
植被指数、高光谱特征参数组合模型 Vegetation index,hyperspectral characteristic | 拔节期Jointing stage | 0.765 | 0.160 | 1.945 | 0.684 | 0.191 | 1.646 |
| 抽穗期Heading stage | 0.748 | 0.172 | 0.873 | 0.706 | 0.187 | 1.718 | |
| 灌浆期Pustulation stage | 0.699 | 0.185 | 1.685 | 0.666 | 0.187 | 1.575 | |
| 成熟期Mature stage | 0.792 | 0.185 | 2.087 | 0.721 | 0.206 | 1.807 | |
| 全生育期Whole growth stage | 0.894 | 0.125 | 2.970 | 0.856 | 0.131 | 2.829 | |
| 敏感波段、植被指数、高光谱特征参数组合模型 Sensitive band, vegetation index, hyperspectral characteristic | 拔节期Jointing stage | 0.924 | 0.064 | 2.720 | 0.928 | 0.063 | 2.762 |
| 抽穗期Heading stage | 0.814 | 0.100 | 2.229 | 0.819 | 0.116 | 2.099 | |
| 灌浆期Pustulation stage | 0.763 | 0.080 | 1.935 | 0.793 | 0.063 | 2.019 | |
| 成熟期Mature stage | 0.755 | 0.127 | 1.906 | 0.853 | 0.080 | 2.765 | |
| 全生育期Whole growth stage | 0.875 | 0.135 | 2.742 | 0.906 | 0.118 | 2.949 | |

图5 PLSR模型的实测值与预测值A:敏感波段;B:植被指数;C: 高光谱特征参数;D: 敏感波段、植被指数;E: 敏感波段、高光谱特征参数;F:植被指数、高光谱特征参数;G:敏感波段、植被指数、高光谱特征参数
Fig. 5 Measured value and predicted value of PLSR modelA: Sensitive waveband; B: Vegetation Index; C: Hyperspectral characteristic parameters; D: Sensitive waveband and vegetation index; E: Sensitive waveband and hyperspectral characteristic parameters; F: Vegetation index and hyperspectral characteristic parameters; G: Sensitive waveband, vegetation index and hyperspectral characteristic parameters
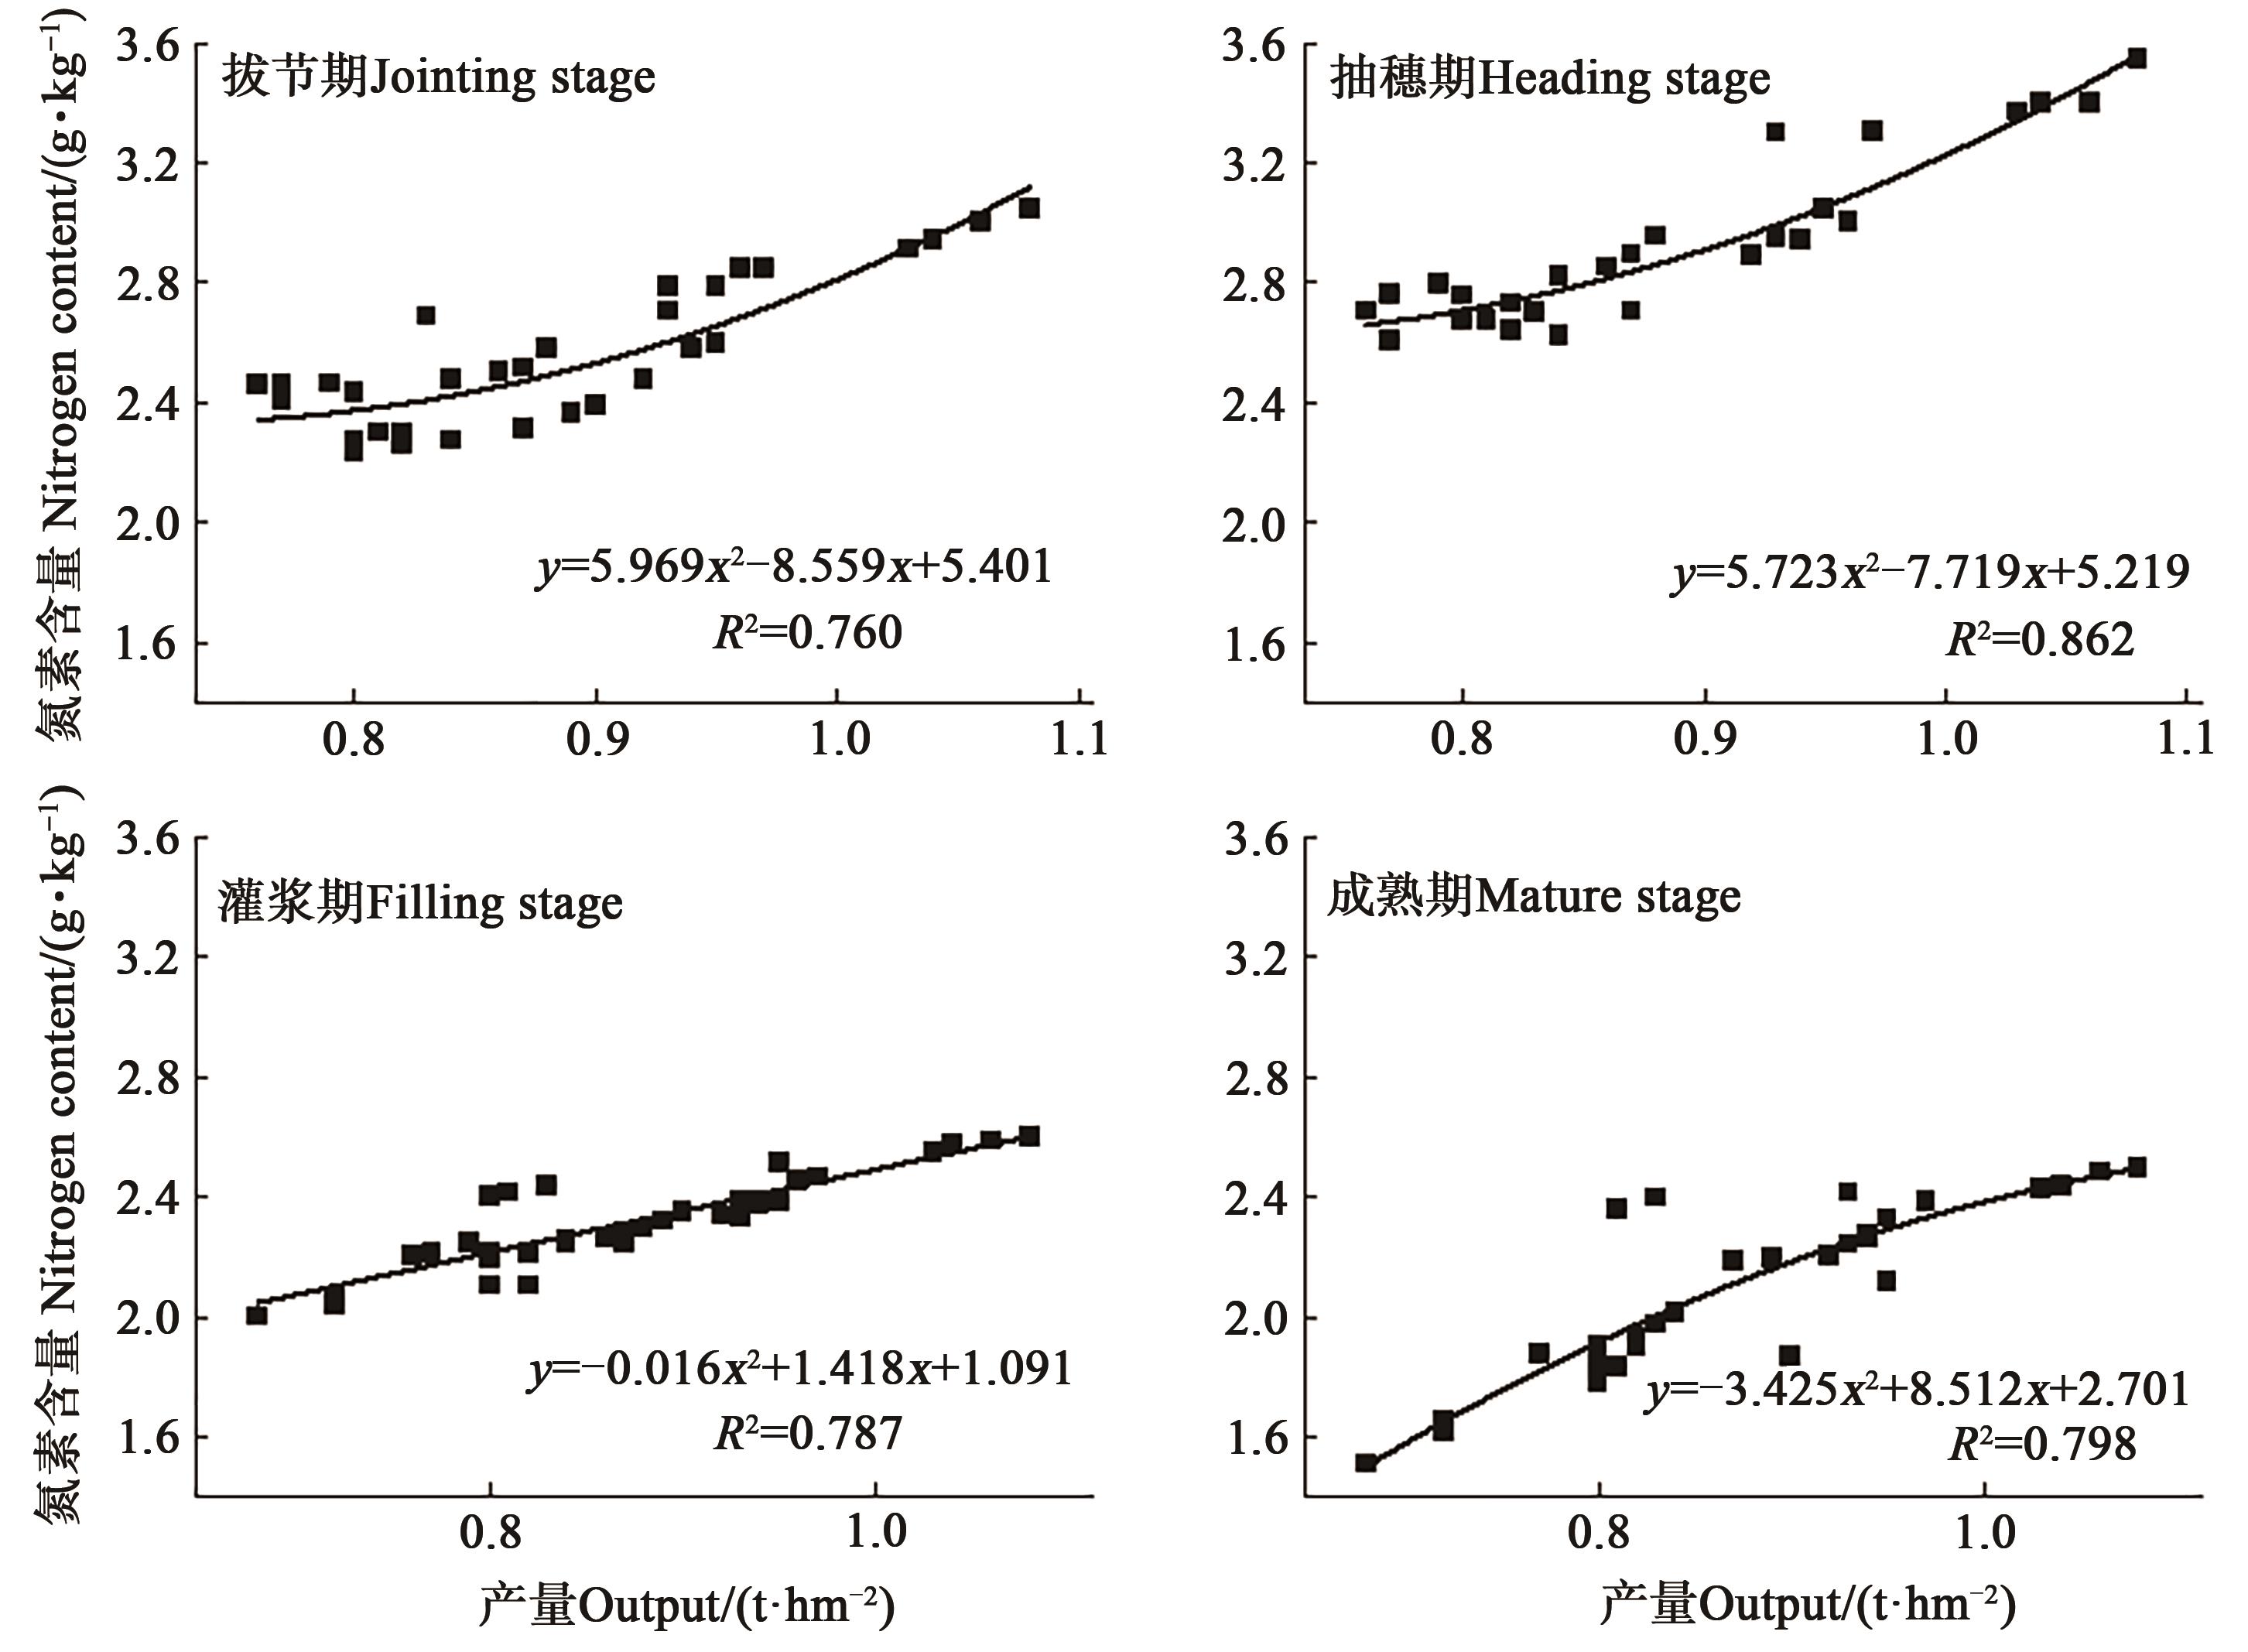
图6 不同生育期谷子产量估测模型回归方程
Fig. 6 Regression equation of millet yield estimation model in different growth stages
| 1 | WANG L, CHEN S, LI D, et al.. Estimation of paddy rice nitrogen content and accumulation both at leaf and plant levels from UAV hyperspectral imagery [J/OL]. Remote Sens., 2021, 13:2956 [2022-09-10]. . |
| 2 | JAY S, MAUPAS F, BENDOULA R, et al.. Retrieving LAI, chlorophyll and nitrogen contents in sugar beet crops from multi-angular optical remote sensing: comparison of vegetation indices and PROSAIL inversion for field phenotyping [J]. Field Crops Res., 2017, 210:33-46. |
| 3 | FENG H Y, FENG S, YAO W, et al.. BAS-ELM based UAV hyperspectral remote sensing inversion modeling of rice canopy nitrogen content [J]. Int. J. Precision Agric. Aviation, 2018, 3(3):59-64. |
| 4 | 喻俊,李晓敏,张权,等.基于高光谱遥感的植被冠层氮素反演方法研究进展[J].陕西林业科技,2016(6):93-97. |
| YU J, LI X M, ZHANG Q, et al.. Research progress of vegetation canopy nitrogen retrieval methods based on hyperspectral remote sensing [J]. Shaanxi For. Sci. Technol., 2016(6):93-97. | |
| 5 | 刘帅兵,杨贵军,景海涛,等.基于无人机数码影像的冬小麦氮含量反演[J].农业工程学报,2019,35(11):75-85. |
| LIU S B, YANG G J, JING H T, et al.. Inversion of winter wheat nitrogen content based on UAV digital image [J]. Trans. Chin. Soc. Agric. Eng., 2019, 35(11):75-85. | |
| 6 | BERGER K, VERRELST J, FÉRET J B, et al.. Crop nitrogen monitoring: recent progress and principal developments in the context of imaging spectroscopy missions [J/OL]. Remote Sens. Environ., 2020, 242:111758 [2022-09-10]. . |
| 7 | 李岚涛,汪善勤,任涛,等.基于高光谱的冬油菜叶片磷含量诊断模型[J].农业工程学报,2016,32(14):209-218. |
| LI L T, WANG S Q, REN T, et al.. Diagnosis model of phosphorus content in winter rape leaves based on hyperspectral analysis [J]. Trans. Chin. Soc. Agric. Eng., 2016, 32(14):209-218. | |
| 8 | 张艾英,郭二虎,王军,等.施氮量对春谷农艺性状、光合特性和产量的影响[J].中国农业科学,2015,48(15):2939-2951. |
| ZHANG A Y, GUO E H, WANG J, et al.. Effects of nitrogen application rate on agronomic characters, photosynthetic characteristics and yield of spring millet [J]. Sci. Agric. Sin., 2015, 48(15):2939-2951. | |
| 9 | 冯帅,曹英丽,许童羽,等.高光谱和NSGA2-ELM算法的粳稻叶片氮素含量反演[J].光谱学与光谱分析,2020,40(8):2584-2591. |
| FENG S, CAO Y L, XU T Y, et al.. Retrieval of nitrogen content in japonica rice leaves by hyperspectral and NSGA2-ELM algorithm [J]. Spectrosc. Spect. Anal., 2020, 40(8):2584-2591. | |
| 10 | 白丽敏,李粉玲,常庆瑞,等.结合SPA和PLS法提高冬小麦冠层全氮高光谱估算的精确度[J].植物营养与肥料学报,2018,24(5):1178-1184. |
| BAI L M, LI F L, CHANG Q R, et al.. Combining SPA and PLS methods to improve the accuracy of winter wheat canopy total nitrogen hyperspectral estimation [J]. J. Plant Nutr. Fert., 2018, 24(5):1178-1184. | |
| 11 | HE L, SONG X, FENG W, et al.. Improved remote sensing of leaf nitrogen concentration in winter wheat using multi-angular hyperspectral data [J]. Remote Sens. Environ., 2016, 174:122-133. |
| 12 | 王玉娜,李粉玲,王伟东,等.基于连续投影算法和光谱变换的冬小麦生物量高光谱遥感估算[J].麦类作物学报,2020,40(11):1389-1398. |
| WANG Y N, LI F L, WANG W D, et al.. Hyperspectral remote sensing estimation of winter wheat biomass based on continuous projection algorithm and spectral transformation [J]. J. Triticeae Crops, 2020, 40(11):1389-1398. | |
| 13 | 辛景树,郑磊,黄耀蓉,等. 植株全氮含量测定自动定氮仪法: [S]. 北京:中国标准出版社, 2013. |
| 14 | 王娇娇,宋晓宇,梅新,等.基于高斯回归分析的水稻氮素敏感波段筛选及含量估算[J].光谱学与光谱分析,2021,41(6):1722-1729. |
| WANG J J, SONG X Y, MEI X, et al.. Screening and content estimation of rice nitrogen sensitive bands based on gaussian regression analysis [J]. Spectrosc. Spect. Anal., 2021, 41(6):1722-1729. | |
| 15 | 冯帅, 许童羽, 于丰华,等.基于无人机高光谱遥感的东北粳稻冠层叶片氮素含量反演方法研究[J].光谱学与光谱分析, 2019, 39(10):3281-3287. |
| FENG S, XU T Y, YU F H, et al.. Retrieval method of nitrogen content in northeast japonica rice canopy based on hyperspectral remote sensing of unmanned aerial vehicle [J]. Spectrosc. Spect. Anal., 2019, 39(10):3281-3287. | |
| 16 | 李丹,李斐,胡云才,等.基于光谱指数波段优化算法的小麦玉米冠层含氮量估测[J].光谱学与光谱分析,2016,36(4):1150-1157. |
| LI D, LI F, HU Y C, et al.. Estimation of nitrogen content in wheat and maize canopy based on spectral index band optimization algorithm [J]. Spectrosc. Spect. Anal., 2016, 36(4):1150-1157. | |
| 17 | 赵小敏,孙小香,王芳东,等.水稻高光谱遥感监测研究综述[J].江西农业大学学报,2019,41(1):1-12. |
| ZHAO X M, SUN X X, WANG F D, et al.. A summary of the researches on hyperspectral remote sensing monitoring of rice [J]. Acta Agric. Univ. Jiangxiensis, 2019, 41(1):1-12. | |
| 18 | 张子晗,晏磊,刘思远,等.基于偏振反射模型和随机森林回归的叶片氮含量反演[J].光谱学与光谱分析,2021,41(9):2911-2917. |
| ZHANG Z H, YAN L, LIU S Y, et al.. Inversion of leaf nitrogen content based on polarization reflection model and stochastic forest regression [J]. Spectrosc. Spect. Anal., 2021, 41(9):2911-2917. | |
| 19 | 冯海宽,杨福芹,杨贵军,等.基于特征光谱参数的苹果叶片叶绿素含量估算[J].农业工程学报,2018,34(6):182-188. |
| FENG H K, YANG F Q, YANG G J, et al.. Estimation of chlorophyll content in apple leaves based on characteristic spectral parameters [J]. Trans. Chin. Soc. Agric. Eng., 2018, 34(6):182-188. | |
| 20 | 张银杰,王磊,白由路,等.基于高光谱分析的玉米叶片氮含量分层诊断研究[J].光谱学与光谱分析,2019,39(9):2829-2835. |
| ZHANG Y J, WANG L, BAI Y L, et al.. Hierarchical diagnosis of nitrogen content in maize leaves based on hyperspectral analysis [J]. Spectrosc. Spect. Anal., 2019, 39(9):2829-2835. | |
| 21 | WU B, HUANG W, YE H, et al.. Using multi-angular hyperspectral data to estimate the vertical distribution of leaf chlorophyll content in wheat [J]. J. Remote. Sens., 2021, 13:1501-1511. |
| [1] | 鲁一薇, 夏雪岩, 赵宇, 崔纪菡, 刘猛, 黄玫红, 褚程, 刘建军, 李顺国. 缺钾胁迫下谷子转录组分析及相关基因挖掘[J]. 中国农业科技导报, 2024, 26(6): 30-44. |
| [2] | 李瑞珍, 姚建民, 王忠祥, 高凤翔, 窦贵新, 杨瑞平, 刘钊, 张继, 张振宇. 全生物降解渗水地膜覆盖冬播谷子产量结构关系分析[J]. 中国农业科技导报, 2023, 25(5): 185-191. |
| [3] | 张会, 王越越, 赵波, 张丽玲, 郄倩茹, 韩渊怀, 李旭凯. 基于WGCNA的谷子苗期冷胁迫应答基因网络构建与核心因子发掘[J]. 中国农业科技导报, 2023, 25(10): 22-34. |
| [4] | 焦雄飞, 于晋, 冯乐勇, 郭耀东, 樊丽生. 不同播期对谷子DUS测试性状的影响[J]. 中国农业科技导报, 2022, 24(8): 55-64. |
| [5] | 赵晋锋, 余爱丽, 李颜方, 杜艳伟, 王高鸿, 王振华. 谷子SiCBL3对非生物胁迫响应特征分析[J]. 中国农业科技导报, 2022, 24(11): 68-75. |
| [6] | 郭瑞锋, 任月梅, 杨忠, 刘贵山, 任广兵, 张绶, 朱文娟. 草甘膦铵盐诱导谷子雄性不育的转录组分析[J]. 中国农业科技导报, 2022, 24(10): 35-43. |
| [7] | 鱼冰星, 王宏富, 王振华, 张鹏, 成锴, 余爱丽, 闫海丽, 鱼冰洁. 多效唑对谷子茎秆特征及抗倒性的影响[J]. 中国农业科技导报, 2021, 23(8): 37-44. |
| [8] | 李冉, 刘宇航, 梁杉, 张敏, . 硒肥对谷子产量因子及其籽粒富硒效果的影响[J]. 中国农业科技导报, 2021, 23(6): 140-146. |
| [9] | 张宇杰, 郭平毅, 郭美俊, 周浩, 原向阳, 董淑琦, 王玉国. 外源硒矿粉对谷子保护酶活性、产量和籽粒中硒含量的影响[J]. 中国农业科技导报, 2021, 23(5): 153-159. |
| [10] | 岳琳祺,郭佳晖,白雄辉,施卫萍,郭平毅*,郭杰*. 叶面喷施硒肥对不同基因型谷子农艺性状及籽粒硒含量的影响[J]. 中国农业科技导报, 2021, 23(4): 154-163. |
| [11] | 田岗, 刘鑫, 王玉文, 刘永忠, 李会霞, 成锴, 王振华, 刘红. 遮光处理对谷子农艺性状、小米品质及蒸煮特性的影响[J]. 中国农业科技导报, 2021, 23(11): 47-54. |
| [12] | 相吉山1,张恒儒2,刘涵1,索良喜2,贾姝婧1,张颖1,史景奇1,胡利喆1,蔡一宁1. 不同生态区谷子种质资源表型比较分析[J]. 中国农业科技导报, 2020, 22(9): 31-41. |
| [13] | 李会霞1§,郑植尹2§,田岗1,刘鑫1,王玉文1,刘红1,史关燕3*. 7个谷子杂交种及其亲本的抗旱性分析[J]. 中国农业科技导报, 2020, 22(7): 20-28. |
| [14] | 李智,王宏富*,王钰云,杨净,鱼冰星,黄珊珊. 谷子大豆间作对作物光合特性及产量的影响[J]. 中国农业科技导报, 2020, 22(6): 168-175. |
| [15] | 王钰云,王宏富*,李智,段宏凯,黄珊珊. 谷子花生间作对谷子光合特性及产量的影响[J]. 中国农业科技导报, 2020, 22(5): 153-165. |
| 阅读次数 | ||||||
|
全文 |
|
|||||
|
摘要 |
|
|||||
 京公网安备11010802021197号