


中国农业科技导报 ›› 2024, Vol. 26 ›› Issue (2): 46-55.DOI: 10.13304/j.nykjdb.2022.0818
李丽花( ), 孙正文, 柯会锋, 谷淇深, 吴立强, 张艳, 张桂寅, 王省芬()
收稿日期:2022-09-25
接受日期:2022-10-18
出版日期:2024-02-15
发布日期:2024-02-04
通讯作者:
王省芬
作者简介:李丽花 E-mail:13473229312@163.com;
基金资助:
Lihua LI(), Zhengwen SUN, Huifeng KE, Qishen GU, Liqiang WU, Yan ZHANG, Guiyin ZHANG, Xingfen WANG()
Received:2022-09-25
Accepted:2022-10-18
Online:2024-02-15
Published:2024-02-04
Contact:
Xingfen WANG
摘要:
纤维强度(fiber strength,FS)是判断棉花纤维品质优劣的重要指标之一,开发可用于目标性状选择的分子标记将会大大提高选择准确性并加快育种进程。设计KASP引物,对国内外的376份品种(系)进行基因型鉴定,筛选多态性标记并验证其对高强纤维材料选择的有效性。3个SNP位点在材料中均具有多态性,标记FS-15对高强纤维材料的选择率为63.2%,FS-16和FS-29分别为60.0%和56.1%。对单倍型组合(Hap1、Hap2、Hap3和Hap4)的有效性评价表明,携带Hap3(TTA)的材料纤维强度显著高于其他组合,对高强纤维材料选择率达72.7%。此外,Hap3对纤维长度、铃重、籽指和衣指无不利影响。以上结果表明,开发的KASP标记及Hap3可用于高纤维强度材料的辅助选择,同时未对纤维长度、铃重、籽指和衣指等性状产生不利影响。
中图分类号:
李丽花, 孙正文, 柯会锋, 谷淇深, 吴立强, 张艳, 张桂寅, 王省芬. 陆地棉纤维强度KASP-SNP标记的开发及效应评价[J]. 中国农业科技导报, 2024, 26(2): 46-55.
Lihua LI, Zhengwen SUN, Huifeng KE, Qishen GU, Liqiang WU, Yan ZHANG, Guiyin ZHANG, Xingfen WANG. Development and Effect Evaluation of KASP Markers for Fiber Strength in Gossypium hirsutum L.[J]. Journal of Agricultural Science and Technology, 2024, 26(2): 46-55.
| 标记 Marker | 等位碱基 Allele | 引物名称 Primer name | 序列 Sequence (5’-3’) |
|---|---|---|---|
| FS-15 | G/T | FS-15-FAM | TTGTTCTTCCAGACACCTTTGAAC |
| FS-15-HEX | CTTTGTTCTTCCAGACACCTTTGAAA | ||
| FS-15-Reverse | AGCTAAAAAATTGGAGGCTGAGAGGAAT | ||
| FS-16 | A/T | FS-15-FAM | AAATTGAGCAAATTCAGGATGGAACCT |
| FS-16-HEX | AAATTGAGCAAATTCAGGATGGAACCA | ||
| FS-15-Reverse | ACATCAAAACAATCTGCTTGTACTGGCTT | ||
| FS-29 | A/G | FS-29-FAM | ACGGAGCTGAAGGATGCAAGTAA |
| FS-29-HEX | CGGAGCTGAAGGATGCAAGTAG | ||
| FS-29-Reverse | GCAAACTCTCGATTTCAAATCCAAAGGTT |
表1 KASP分子标记引物序列
Table 1 Primer sequences used for KASP assays
| 标记 Marker | 等位碱基 Allele | 引物名称 Primer name | 序列 Sequence (5’-3’) |
|---|---|---|---|
| FS-15 | G/T | FS-15-FAM | TTGTTCTTCCAGACACCTTTGAAC |
| FS-15-HEX | CTTTGTTCTTCCAGACACCTTTGAAA | ||
| FS-15-Reverse | AGCTAAAAAATTGGAGGCTGAGAGGAAT | ||
| FS-16 | A/T | FS-15-FAM | AAATTGAGCAAATTCAGGATGGAACCT |
| FS-16-HEX | AAATTGAGCAAATTCAGGATGGAACCA | ||
| FS-15-Reverse | ACATCAAAACAATCTGCTTGTACTGGCTT | ||
| FS-29 | A/G | FS-29-FAM | ACGGAGCTGAAGGATGCAAGTAA |
| FS-29-HEX | CGGAGCTGAAGGATGCAAGTAG | ||
| FS-29-Reverse | GCAAACTCTCGATTTCAAATCCAAAGGTT |
| 年份Year | 环境 Environment | 最大值Max/(cN·tex-1) | 最小值Min/ (cN·tex-1) | 平均值Mean/ (cN·tex-1) | 标准差 SD | 偏度 Skew | 峰度 Kurt | 变异系数 CV/% |
|---|---|---|---|---|---|---|---|---|
| 2014 | E1:保定Baoding | 35.80 | 23.30 | 29.38 | 2.51 | 0.11 | -0.045 | 8.54 |
| E2:河间Hejian | 34.80 | 24.20 | 29.17 | 2.24 | 0.31 | -0.26 | 7.68 | |
| E3:辛集Xinji | 36.30 | 25.20 | 30.80 | 2.21 | 0.068 | -0.004 | 7.18 | |
| E4:青县Qing county | 36.80 | 24.80 | 30.08 | 2.16 | 0.16 | 0.066 | 7.18 | |
| E5:崖城Yacheng | 36.30 | 23.30 | 28.47 | 2.12 | 0.34 | 0.39 | 7.45 | |
| 2015 | E6:辛集Xinji | 37.47 | 23.23 | 31.01 | 2.01 | 0.059 | 0.89 | 6.48 |
| E7:青县Qing county | 35.51 | 19.91 | 28.39 | 2.34 | 0.044 | 0.29 | 8.24 | |
| E8:崖城Yacheng | 31.61 | 22.70 | 25.61 | 1.76 | 0.68 | 0.30 | 6.87 |
表2 376份材料在8个环境下纤维强度的变异分析
Table 2 Phenotypic variation for fiber strength of 376 accessions in 8 environments
| 年份Year | 环境 Environment | 最大值Max/(cN·tex-1) | 最小值Min/ (cN·tex-1) | 平均值Mean/ (cN·tex-1) | 标准差 SD | 偏度 Skew | 峰度 Kurt | 变异系数 CV/% |
|---|---|---|---|---|---|---|---|---|
| 2014 | E1:保定Baoding | 35.80 | 23.30 | 29.38 | 2.51 | 0.11 | -0.045 | 8.54 |
| E2:河间Hejian | 34.80 | 24.20 | 29.17 | 2.24 | 0.31 | -0.26 | 7.68 | |
| E3:辛集Xinji | 36.30 | 25.20 | 30.80 | 2.21 | 0.068 | -0.004 | 7.18 | |
| E4:青县Qing county | 36.80 | 24.80 | 30.08 | 2.16 | 0.16 | 0.066 | 7.18 | |
| E5:崖城Yacheng | 36.30 | 23.30 | 28.47 | 2.12 | 0.34 | 0.39 | 7.45 | |
| 2015 | E6:辛集Xinji | 37.47 | 23.23 | 31.01 | 2.01 | 0.059 | 0.89 | 6.48 |
| E7:青县Qing county | 35.51 | 19.91 | 28.39 | 2.34 | 0.044 | 0.29 | 8.24 | |
| E8:崖城Yacheng | 31.61 | 22.70 | 25.61 | 1.76 | 0.68 | 0.30 | 6.87 |
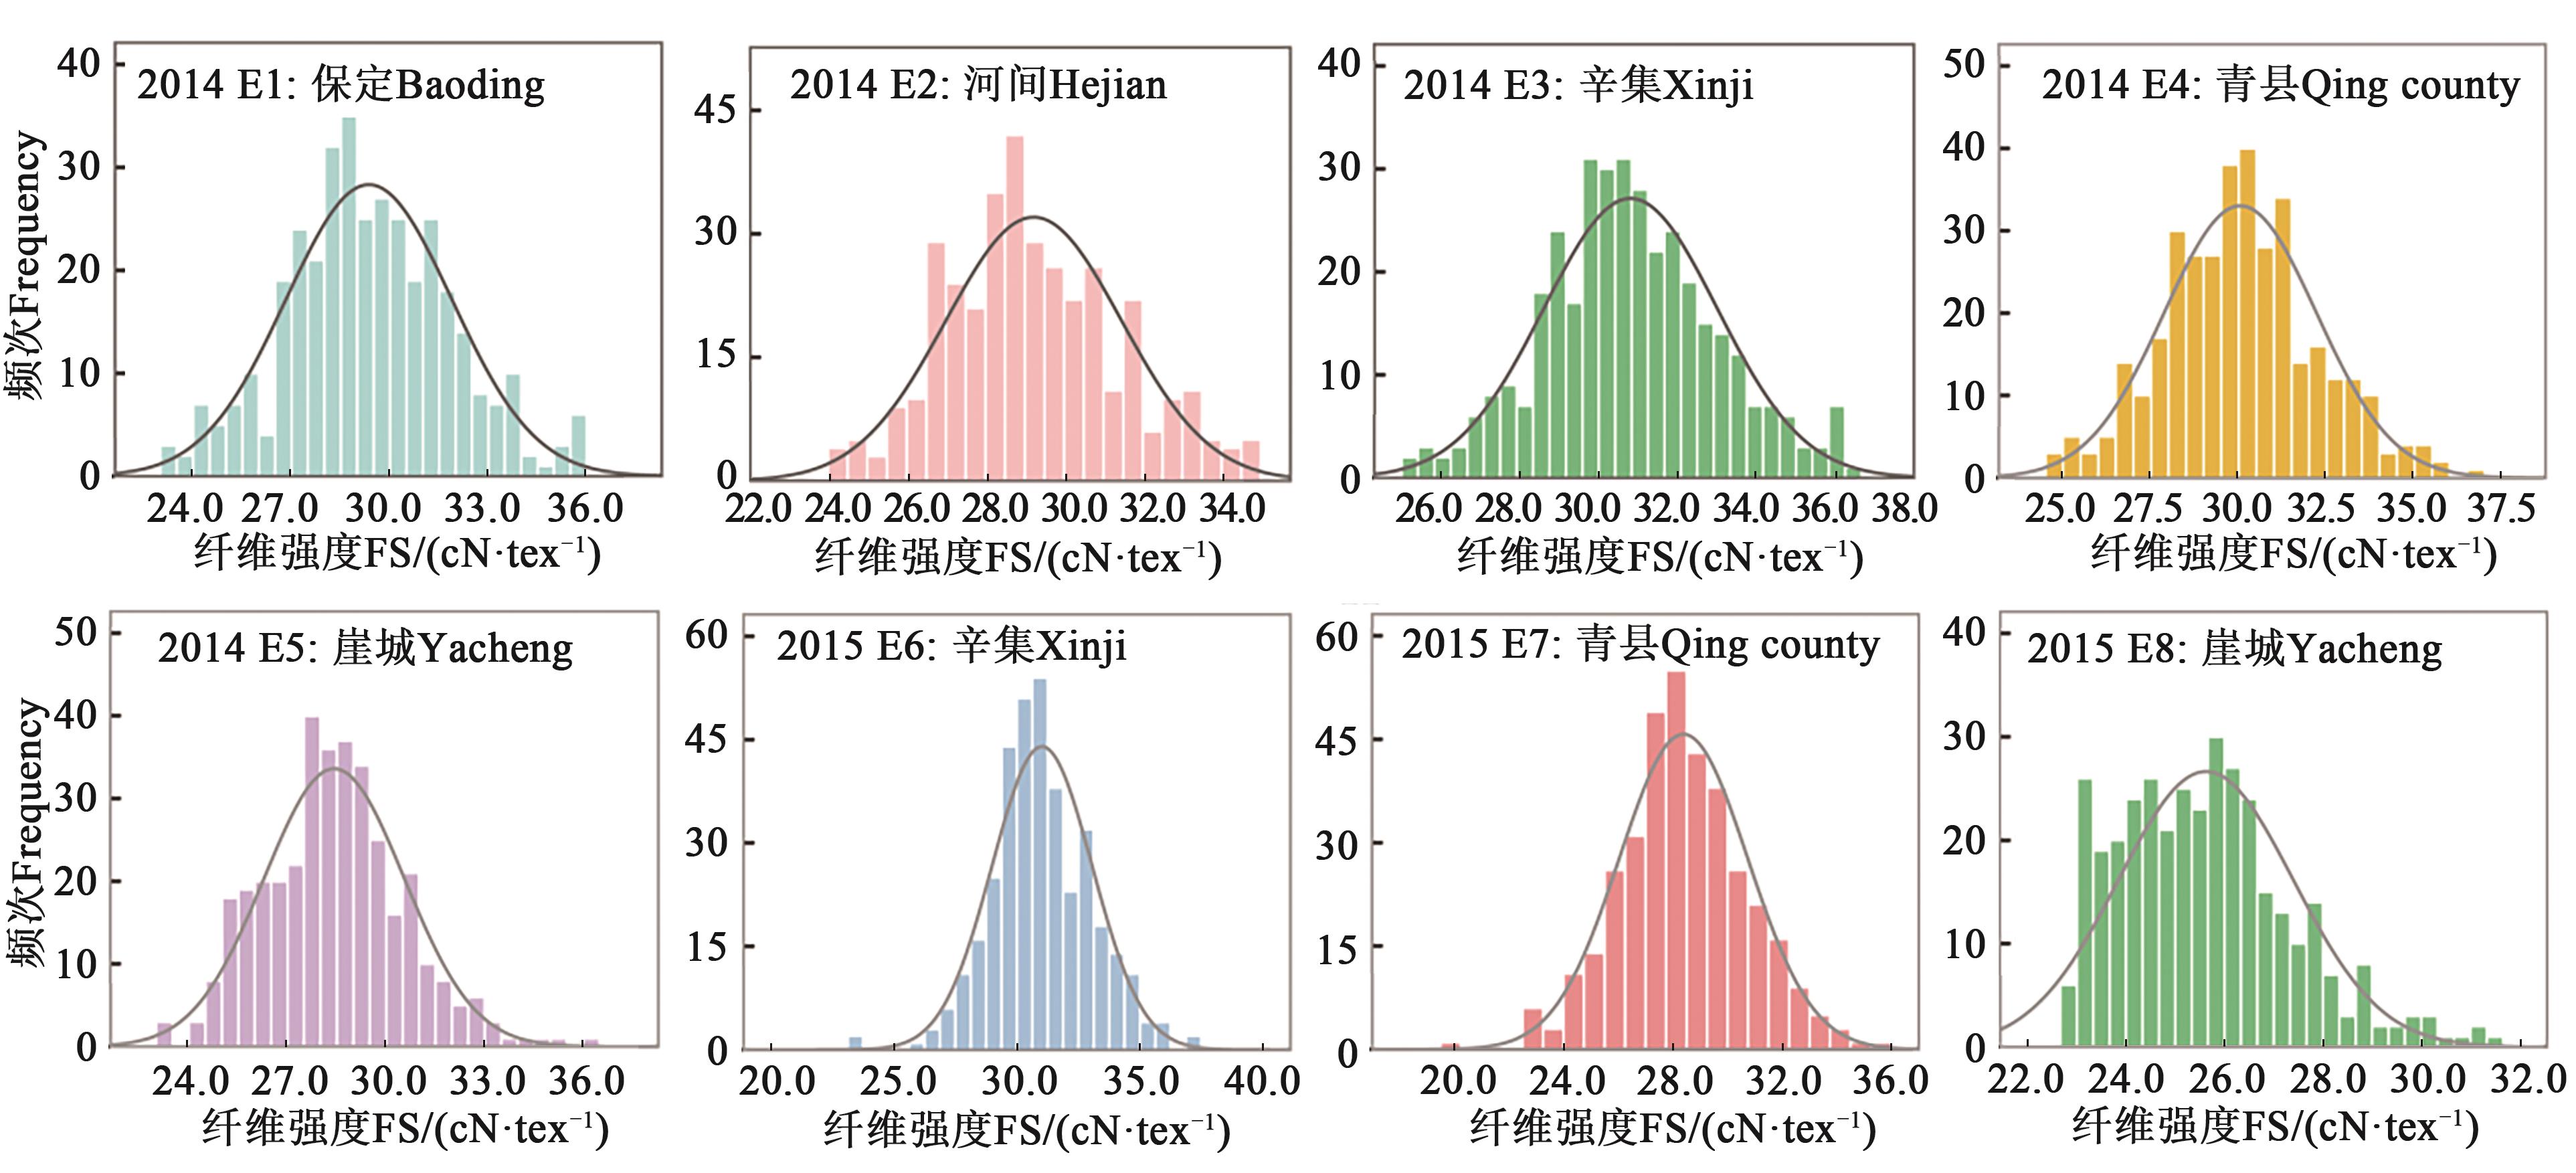
图1 376份陆地棉材料纤维强度频次分布
Fig. 1 FS frequency distribution of 376 upland cotton accessions
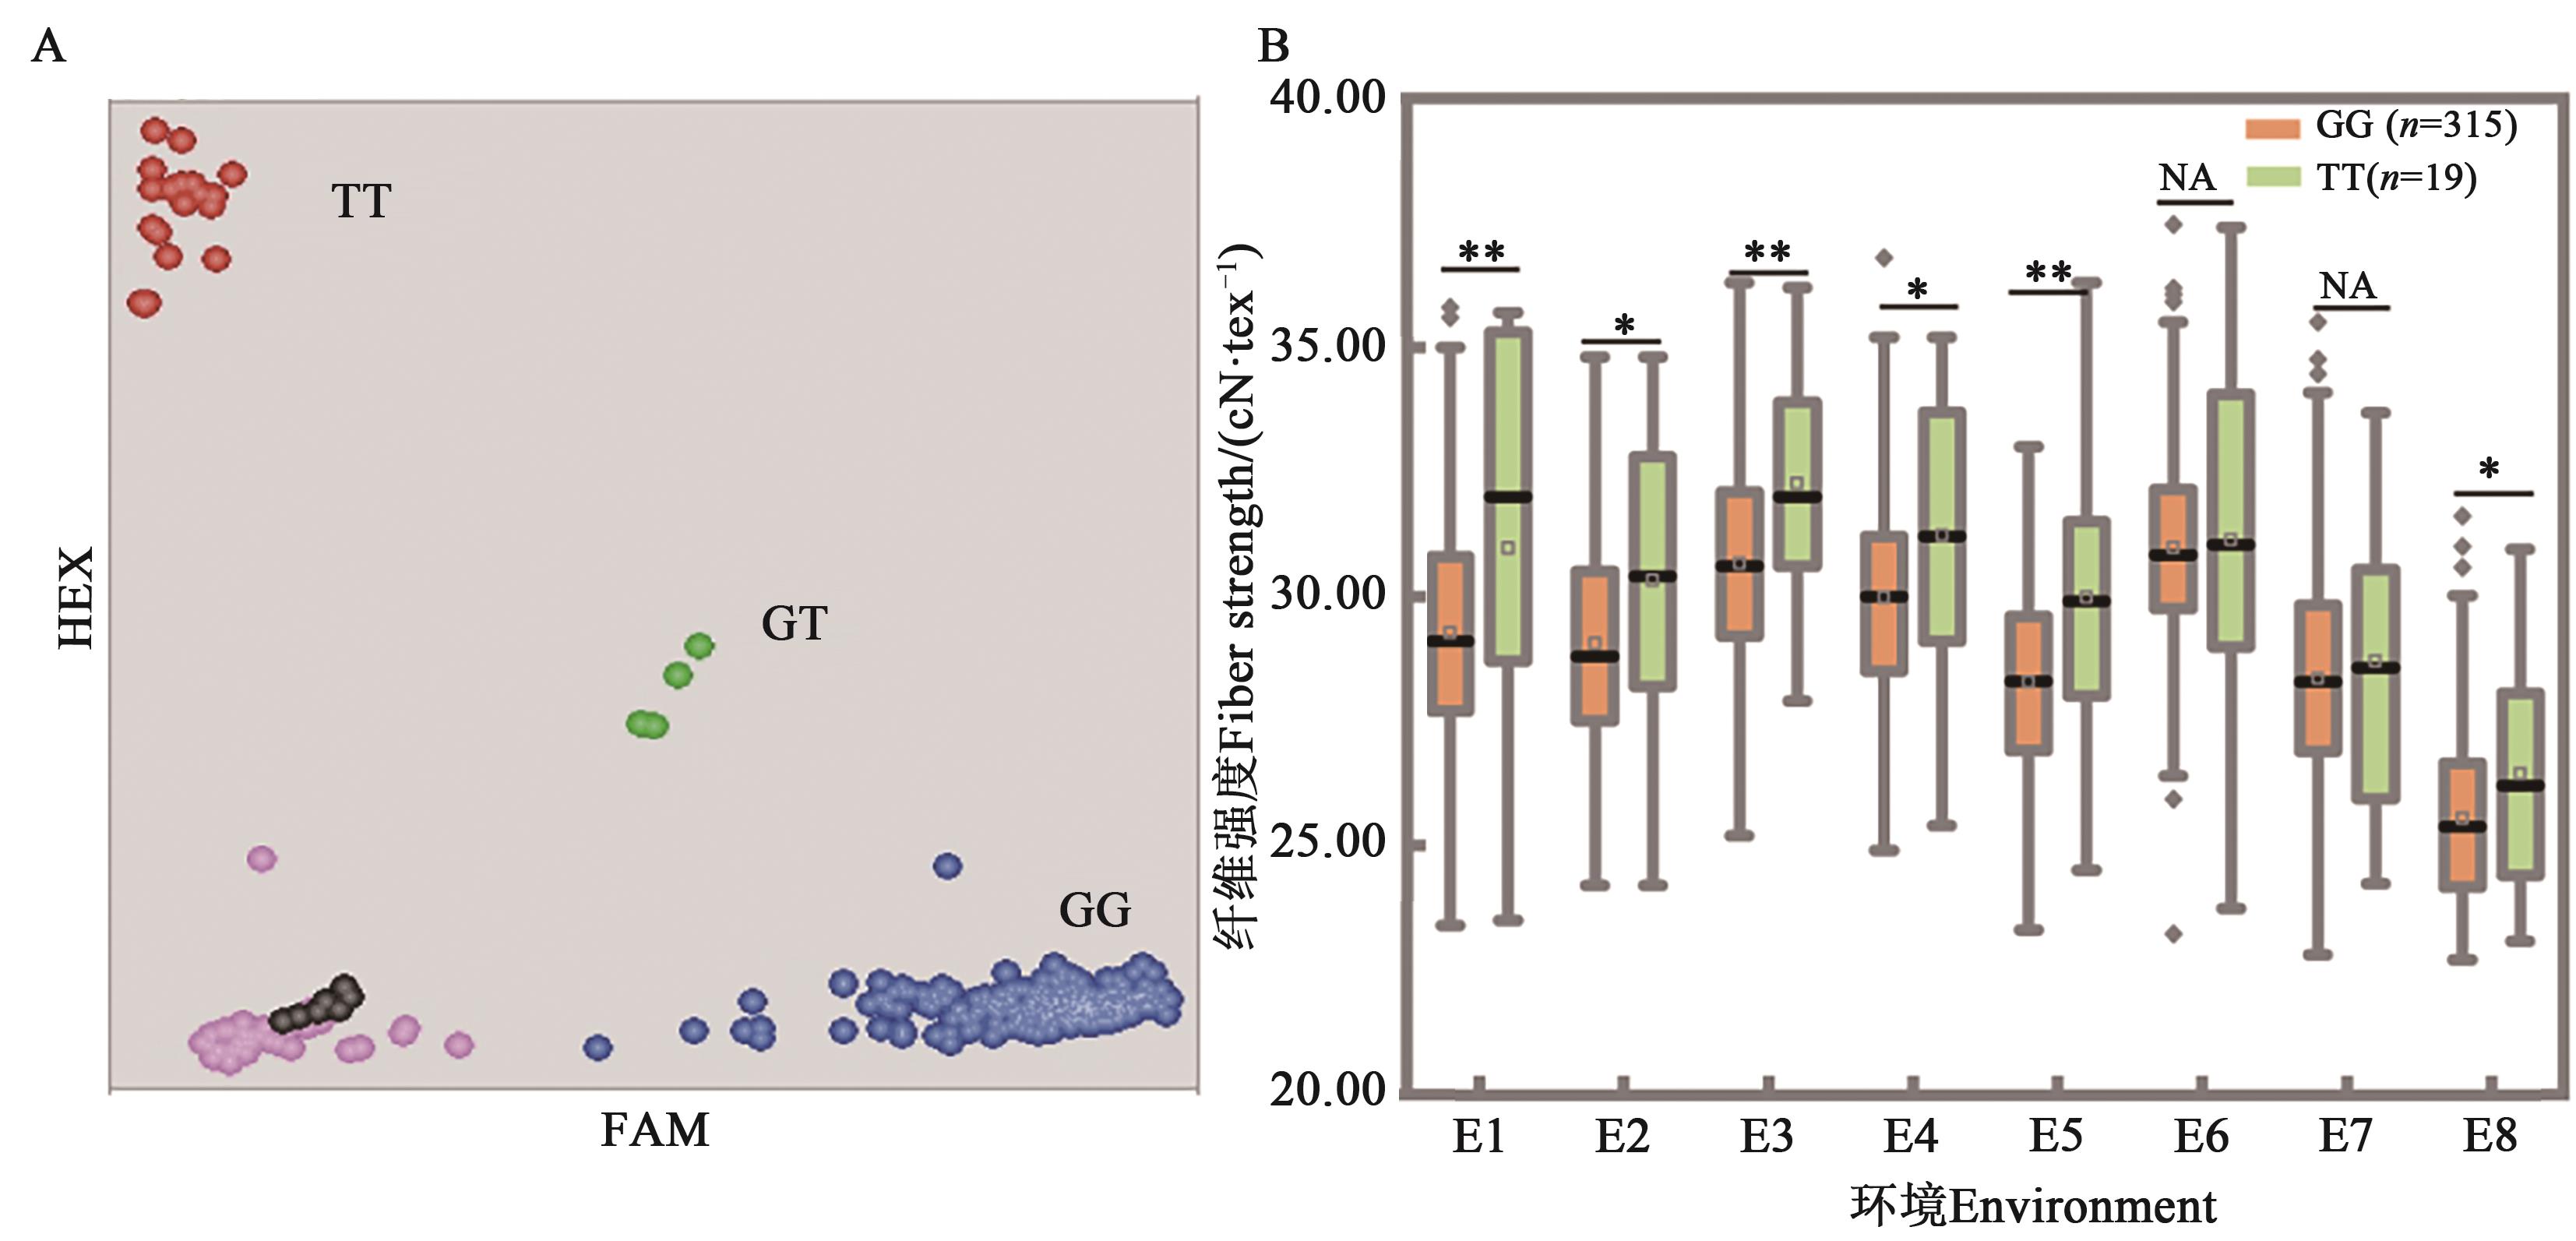
图2 引物FS-15在376份材料中的分型结果及对纤维强度的影响A:分型结果,每个圆点代表1个材料,红色、蓝色分别表示纯合基因型,绿色代表杂合型,粉色代表分型失败材料,黑点为空白对照;B:等位基因效应,*和**分别表示P<0.05和P<0.01水平差异显著,NA表示差异不显著;环境编号同表2
Fig. 2 Genotyping results of FS-15 in the population and allelic effects on fiber strengthA: Genotyping results of accessions, each dot represents 1 material,the red and blue represent homozygous, green represents heterozygous, pink represents failed data and black represents the non-template control, respectively; B: Allele effects, * and ** indicate significant difference at P<0.05 and P<0.01 levels, respectively, and NA indicates no significant difference; code of environment is same as Table 2
| 年份Year | 环境 Environment | FS-15/ (cN·tex-1) | 效应值 Allele effect G<T | 概率值 P-value | FS-16/ (cN·tex-1) | 效应值 Allele effect A<T | 概率值 P-value | FS-29/ (cN·tex-1) | 效应值 Allele effect G<A | 概率值 P-value | |||
|---|---|---|---|---|---|---|---|---|---|---|---|---|---|
| GG | TT | AA | TT | AA | GG | ||||||||
| 2014 | E1:保定Baoding | 29.27 | 30.97 | 1.70 | 0.003 9 | 29.26 | 30.80 | 1.54 | 0.008 2 | 29.49 | 28.91 | 0.58 | 0.082 8 |
| E2:河间Hejian | 29.06 | 30.32 | 1.26 | 0.017 8 | 29.12 | 30.21 | 1.08 | 0.036 0 | 29.27 | 28.83 | 0.44 | 0.139 7 | |
| E3:辛集Xinji | 30.67 | 32.27 | 1.61 | 0.002 0 | 30.74 | 32.11 | 1.36 | 0.006 7 | 30.81 | 30.63 | 0.18 | 0.543 5 | |
| E4:青县Qing county | 29.99 | 31.23 | 1.24 | 0.014 4 | 30.00 | 31.15 | 1.15 | 0.021 0 | 30.24 | 29.37 | 0.87 | 0.002 1 | |
| E5:崖城Yacheng | 28.29 | 29.98 | 1.69 | 0.000 5 | 28.38 | 29.84 | 1.46 | 0.002 9 | 28.58 | 27.93 | 0.65 | 0.020 9 | |
| 2015 | E6:辛集Xinji | 30.98 | 31.14 | 0.15 | 0.753 9 | 30.97 | 31.09 | 0.12 | 0.798 9 | 31.03 | 30.92 | 0.11 | 0.693 7 |
| E7:青县Qing county | 28.36 | 28.70 | 0.35 | 0.538 9 | 28.34 | 28.68 | 0.34 | 0.527 4 | 28.58 | 27.83 | 0.75 | 0.015 8 | |
| E8:崖城Yacheng | 25.54 | 26.44 | 0.90 | 0.031 4 | 25.56 | 26.39 | 0.83 | 0.041 7 | 25.76 | 24.98 | 0.78 | 0.000 7 | |
表3 KASP-SNP对纤维强度性状的影响
Table 3 Allelic effects of KASP-SNP markers on fiber strength
| 年份Year | 环境 Environment | FS-15/ (cN·tex-1) | 效应值 Allele effect G<T | 概率值 P-value | FS-16/ (cN·tex-1) | 效应值 Allele effect A<T | 概率值 P-value | FS-29/ (cN·tex-1) | 效应值 Allele effect G<A | 概率值 P-value | |||
|---|---|---|---|---|---|---|---|---|---|---|---|---|---|
| GG | TT | AA | TT | AA | GG | ||||||||
| 2014 | E1:保定Baoding | 29.27 | 30.97 | 1.70 | 0.003 9 | 29.26 | 30.80 | 1.54 | 0.008 2 | 29.49 | 28.91 | 0.58 | 0.082 8 |
| E2:河间Hejian | 29.06 | 30.32 | 1.26 | 0.017 8 | 29.12 | 30.21 | 1.08 | 0.036 0 | 29.27 | 28.83 | 0.44 | 0.139 7 | |
| E3:辛集Xinji | 30.67 | 32.27 | 1.61 | 0.002 0 | 30.74 | 32.11 | 1.36 | 0.006 7 | 30.81 | 30.63 | 0.18 | 0.543 5 | |
| E4:青县Qing county | 29.99 | 31.23 | 1.24 | 0.014 4 | 30.00 | 31.15 | 1.15 | 0.021 0 | 30.24 | 29.37 | 0.87 | 0.002 1 | |
| E5:崖城Yacheng | 28.29 | 29.98 | 1.69 | 0.000 5 | 28.38 | 29.84 | 1.46 | 0.002 9 | 28.58 | 27.93 | 0.65 | 0.020 9 | |
| 2015 | E6:辛集Xinji | 30.98 | 31.14 | 0.15 | 0.753 9 | 30.97 | 31.09 | 0.12 | 0.798 9 | 31.03 | 30.92 | 0.11 | 0.693 7 |
| E7:青县Qing county | 28.36 | 28.70 | 0.35 | 0.538 9 | 28.34 | 28.68 | 0.34 | 0.527 4 | 28.58 | 27.83 | 0.75 | 0.015 8 | |
| E8:崖城Yacheng | 25.54 | 26.44 | 0.90 | 0.031 4 | 25.56 | 26.39 | 0.83 | 0.041 7 | 25.76 | 24.98 | 0.78 | 0.000 7 | |

图3 引物FS-16在376份材料中的分型结果及对纤维强度性状度的影响A:分型结果,每个圆点代表1个材料,红色、蓝色分别表示纯合基因型,绿色代表杂合型,粉色代表分型失败材料,黑点为空白对照;B:等位基因效应,*和**分别表示P<0.05和P<0.01水平差异显著,NA表示差异不显著;环境编号同表2
Fig. 3 Genotyping results of FS-16 in the population and allelic effects on fiber strengthA: Genotyping results of accessions, each dot represents 1 material,the red and blue represent homozygous, green represents heterozygous, pink represents failed data and black represents the non-template control, respectively; B: Allele effects, * and ** indicate significant difference at P<0.05 and P<0.01 levels, respectively, and NA indicates no significant difference; code of environment is same as Table 2
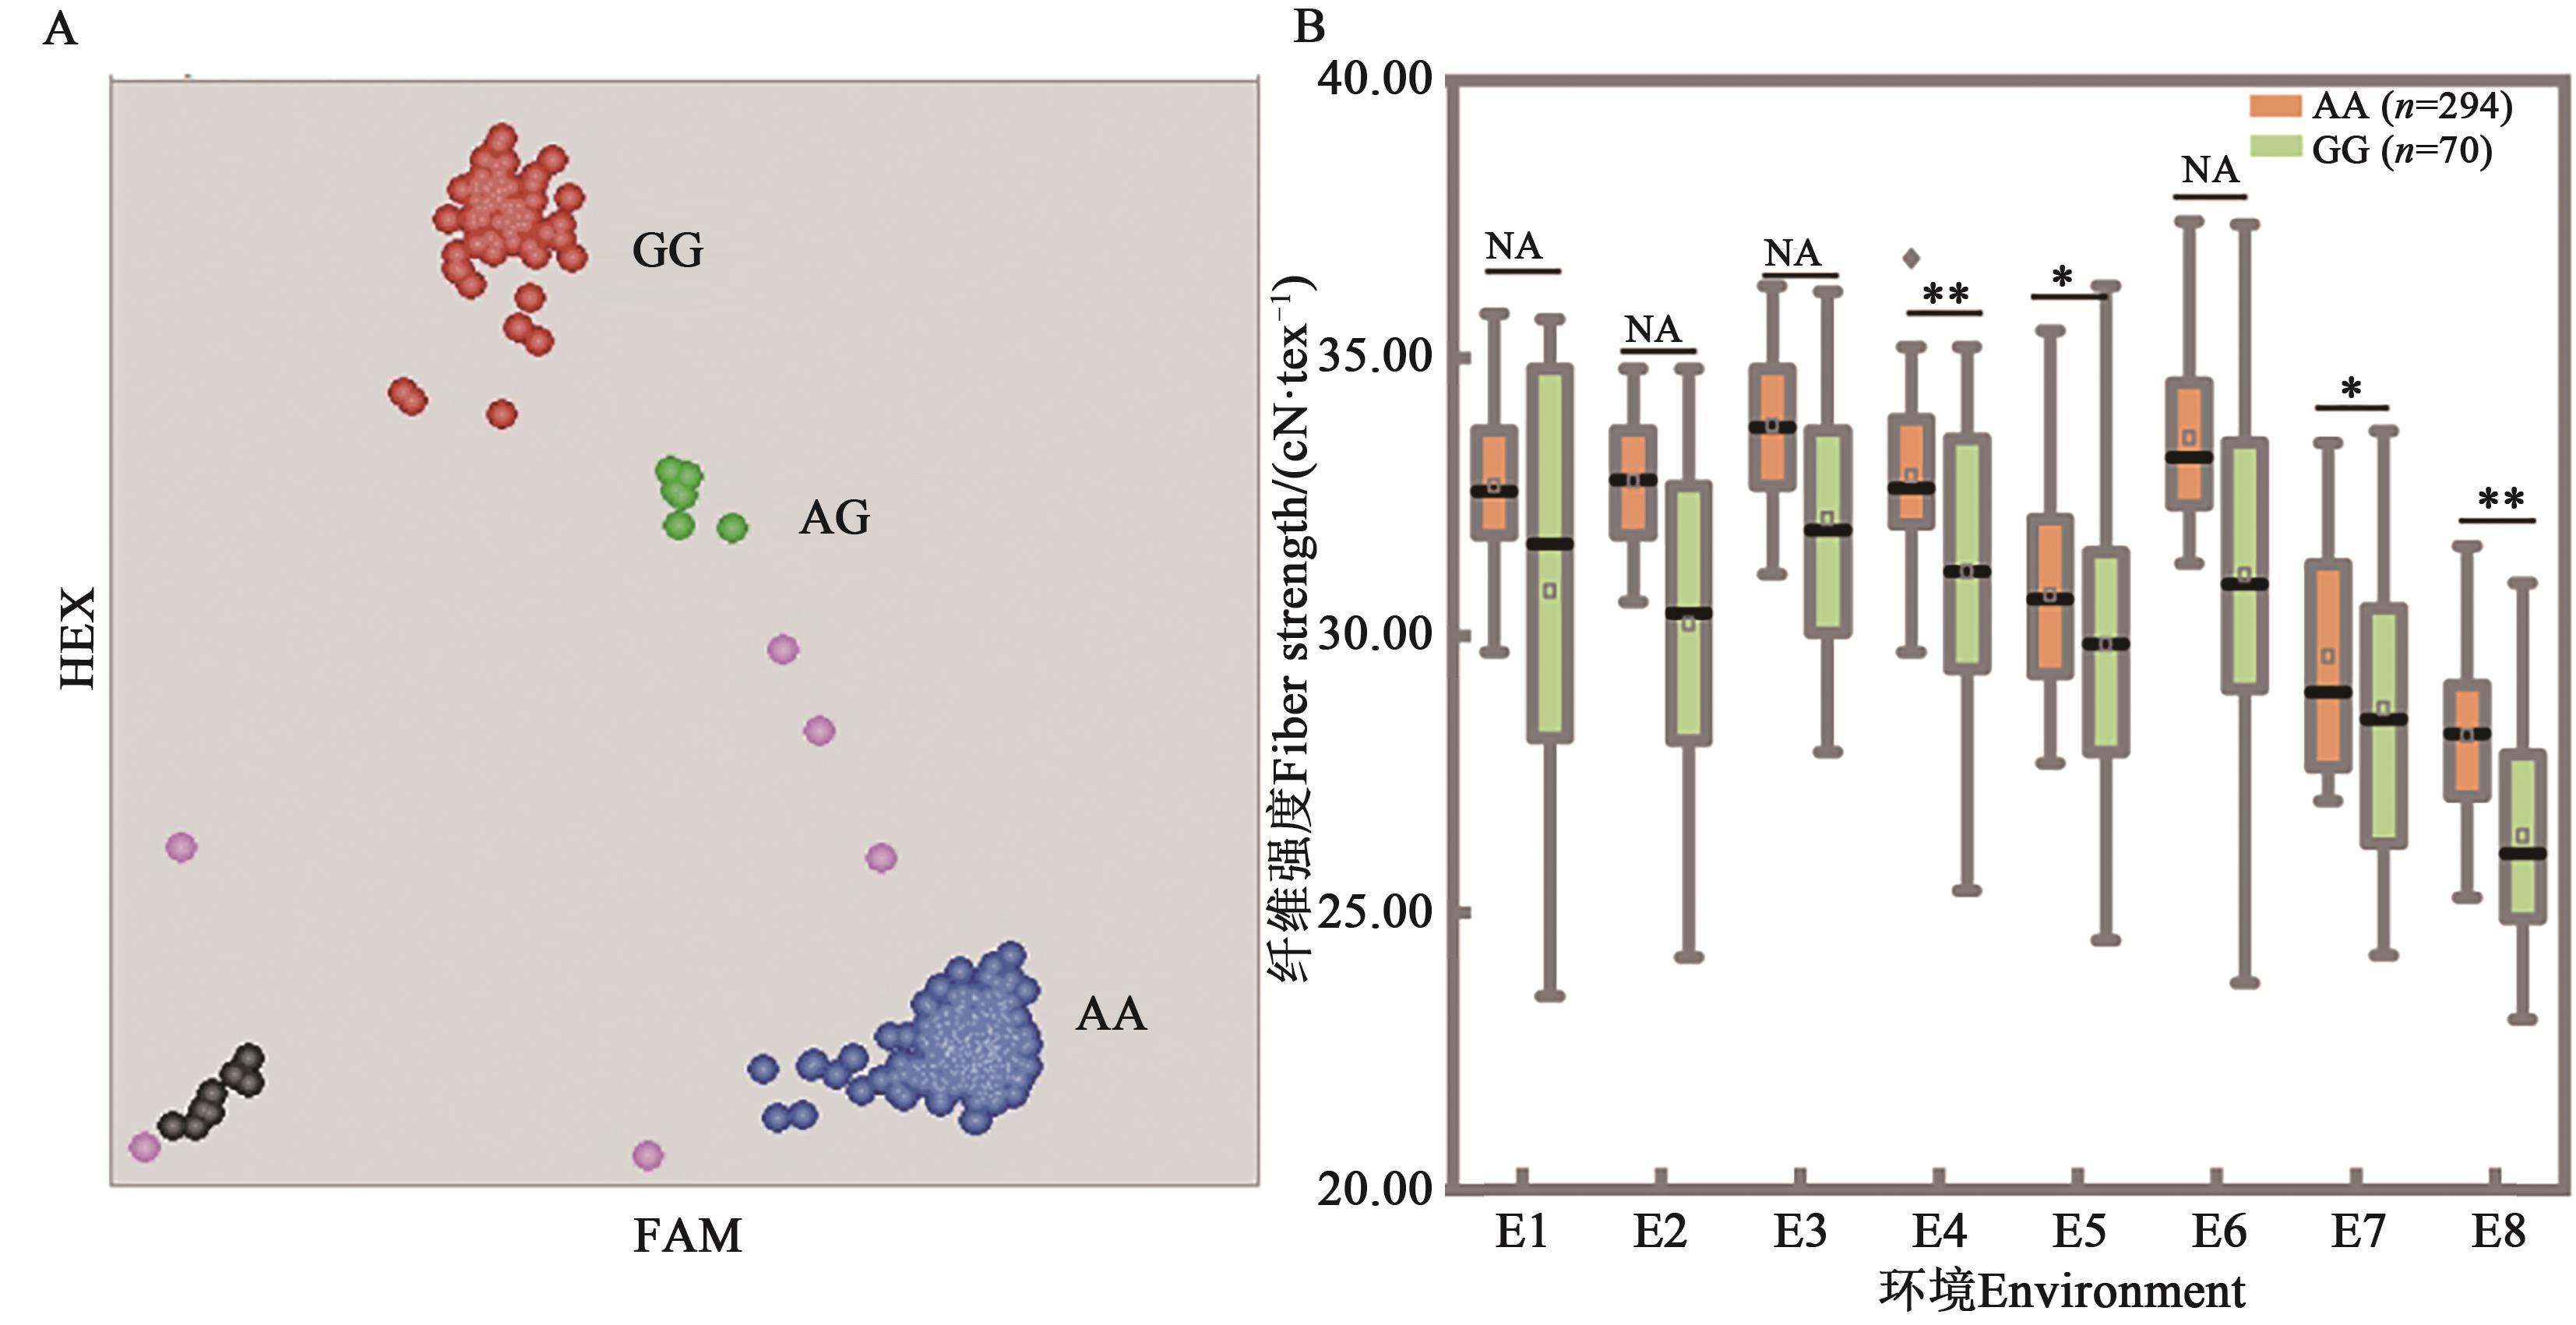
图4 引物FS-29在376份材料中的分型结果及对纤维强度性状度的影响A:分型结果,每个圆点代表1个材料,红色、蓝色分别表示纯合基因型,绿色代表杂合型,粉色代表分型失败材料,黑点为空白对照;B:等位基因效应,*和**分别表示P<0.05和P<0.01水平差异显著,NA表示差异不显著;环境编号同表2
Fig. 4 Genotyping results of FS-29 in the population and allelic effects on fiber strengthA: Genotyping results of accessions, each dot represents 1 material,the red and blue represent homozygous, green represents heterozygous, pink represents failed data and black represents the non-template control, respectively; B: Allele effects, * and ** indicate significant difference at P<0.05 and P<0.01 levels, respectively, and NA indicates no significant difference; code of environment is same as Table 2
基因 Gene | 标记 Marker | 等位基因(样本数) Allele (number) | 平均值Average/ (cN·tex-1) | 等位效应 Allele effect | 选择率(样本数) Selection rate/%(number) | 概率值 P value |
|---|---|---|---|---|---|---|
| Gh_A07G1766(G/T) | FS-15 | G(315) T(19) | 29.12 30.21 | 1.09 | 50.5(159) 63.2(12) | 0.006 9 |
| Gh_A07G1765 (A/T) | FS-16 | A(336) T(20) | 29.15 30.10 | 0.95 | 51.8(174) 60.0(12) | 0.016 0 |
| Gh_D11G1931 (A/G) | FS-29 | A(294) G(70) | 29.35 28.77 | 0.57 | 56.1(165) 40.0(28) | 0.010 5 |
表4 3个KASP-SNP标记对纤维强度性状的影响
Table 4 Allelic effects of 3 markers in the population of 376 accessions
基因 Gene | 标记 Marker | 等位基因(样本数) Allele (number) | 平均值Average/ (cN·tex-1) | 等位效应 Allele effect | 选择率(样本数) Selection rate/%(number) | 概率值 P value |
|---|---|---|---|---|---|---|
| Gh_A07G1766(G/T) | FS-15 | G(315) T(19) | 29.12 30.21 | 1.09 | 50.5(159) 63.2(12) | 0.006 9 |
| Gh_A07G1765 (A/T) | FS-16 | A(336) T(20) | 29.15 30.10 | 0.95 | 51.8(174) 60.0(12) | 0.016 0 |
| Gh_D11G1931 (A/G) | FS-29 | A(294) G(70) | 29.35 28.77 | 0.57 | 56.1(165) 40.0(28) | 0.010 5 |
| 标记Marker | Hap1 | Hap2 | Hap3 | Hap4 |
|---|---|---|---|---|
| FS-15(G/T) | G | G | T | T |
| FS-16(A/T) | A | A | T | T |
| FS-29(A/G) | A | G | A | G |
表5 单倍型组合
Table 5 Haplotype combination
| 标记Marker | Hap1 | Hap2 | Hap3 | Hap4 |
|---|---|---|---|---|
| FS-15(G/T) | G | G | T | T |
| FS-16(A/T) | A | A | T | T |
| FS-29(A/G) | A | G | A | G |
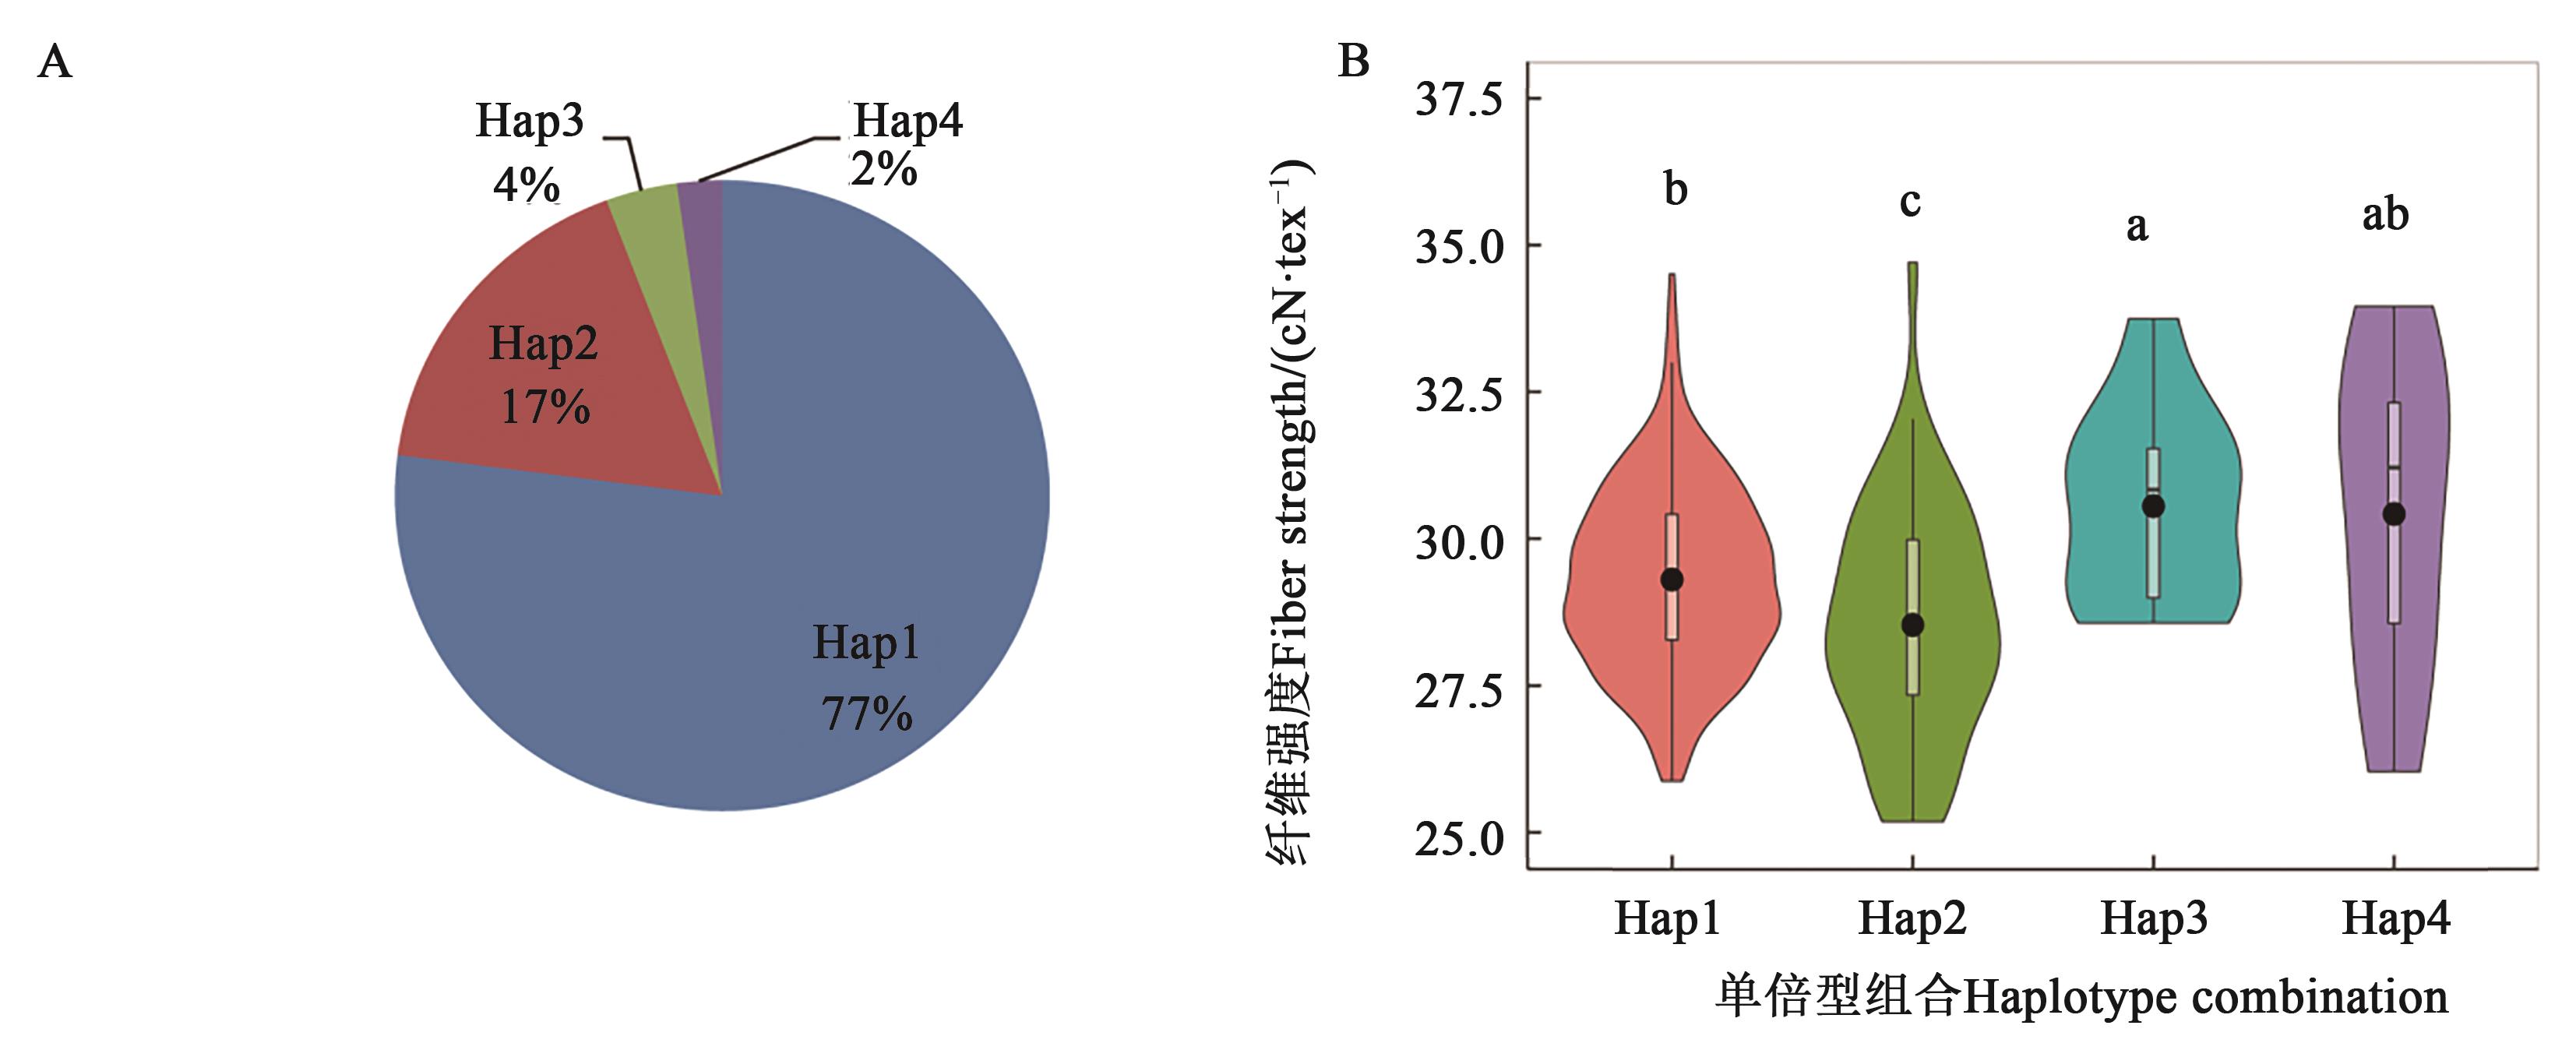
图5 基于3个KASP标记构成的不同单倍型组合对强度性状的影响A:4种主要单倍型组合在376份材料出现频率;B:不同单倍型组合对纤维强度的影响,不同小写字母代表多重比较后显著性P<0.05
Fig. 5 Effects of different haplotype combination on fiber strength based on 3 KASP markersA: Frequency of four mainly haplotype combination in 376 accessions; B: Effect of different haplotype combianation on fiber strength, different lowercase letters represent Duncan’s multiple comparison at P<0.05 level
单倍型组合(样本数) Haplotype combination (number) | 纤维强度 Fiber strength/(cN·tex-1) | 选择率(样本数) Selection rate /% (number) | 概率值 P value |
|---|---|---|---|
| Hap1(242) | 29.30±1.54 b | 55.9(133) | 1.62×10⁻⁴ |
| Hap2(54) | 28.53±1.65 c | 38.9(21) | |
| Hap3(11) | 30.56±1.73 a | 72.7(8) | |
| Hap4(7) | 30.42±2.79 ab | 57.1(4) |
表6 不同单倍型组合对高强度纤维材料
Table 6 Effect of different haplotypes combination on accessions with high fiber strength
单倍型组合(样本数) Haplotype combination (number) | 纤维强度 Fiber strength/(cN·tex-1) | 选择率(样本数) Selection rate /% (number) | 概率值 P value |
|---|---|---|---|
| Hap1(242) | 29.30±1.54 b | 55.9(133) | 1.62×10⁻⁴ |
| Hap2(54) | 28.53±1.65 c | 38.9(21) | |
| Hap3(11) | 30.56±1.73 a | 72.7(8) | |
| Hap4(7) | 30.42±2.79 ab | 57.1(4) |
单倍型组合(样本数) Haplotype combination (number) | 纤维长度 FL/mm | 概率值 P value | 铃重 BW/g | 概率值 P-value | 籽指 SI/g | 概率值 P-value | 衣指 LI/g | 概率值 P value |
|---|---|---|---|---|---|---|---|---|
| Hap1(242) | 29.18±0.99 b | 5.45×10⁻⁷ | 6.1±0.48 ab | 0.028 | 11.1±0.83 ab | 0.016 | 7.26±0.27 ab | 0.021 |
| Hap2(54) | 28.37±1.14 c | 5.93±0.43 b | 10.91±0.90 b | 7.08±0.67 b | ||||
| Hap3(11) | 29.71±0.90 a | 6.29±0.42 a | 11.59±1.04 a | 7.74±1.01 a | ||||
| Hap4(7) | 29.3±1.30 ab | 5.92±0.34 b | 11.63±0.92 a | 7.09±0.41 b |
表 7 不同单倍型组合对纤维其他重要性状的影响
Table 7 Effects ofdifferent haplotype combinationon other traits
单倍型组合(样本数) Haplotype combination (number) | 纤维长度 FL/mm | 概率值 P value | 铃重 BW/g | 概率值 P-value | 籽指 SI/g | 概率值 P-value | 衣指 LI/g | 概率值 P value |
|---|---|---|---|---|---|---|---|---|
| Hap1(242) | 29.18±0.99 b | 5.45×10⁻⁷ | 6.1±0.48 ab | 0.028 | 11.1±0.83 ab | 0.016 | 7.26±0.27 ab | 0.021 |
| Hap2(54) | 28.37±1.14 c | 5.93±0.43 b | 10.91±0.90 b | 7.08±0.67 b | ||||
| Hap3(11) | 29.71±0.90 a | 6.29±0.42 a | 11.59±1.04 a | 7.74±1.01 a | ||||
| Hap4(7) | 29.3±1.30 ab | 5.92±0.34 b | 11.63±0.92 a | 7.09±0.41 b |
| 1 | KUMAR V, SINGH B, SINGH S K, et al.. Role of GhHDA5 in H3K9 deacetylation and fiber initiation in Gossypium hirsutum [J]. Plant J., 2018, 95(6): 1069-1083. |
| 2 | SMITH W C. Cotton: Origin, History, Technology, and Production [M]. New York: Wiley, 1999: 269-288. |
| 3 | ZHANG T Z, YUAN Y L, YU J, et al.. Molecular tagging of a major QTL for fiber strength in Upland cotton and its marker-assisted selection [J]. Theor. Appl. Genet., 2003, 106:262-268. |
| 4 | BASRA A S. Cotton fibers—developmental biology, quality improvement, and textile processing [M]. New York: Food Products Press, 1999: 183-229. |
| 5 | MEREDITH W R. Minimum number of genes controlling cotton fiber strength in a backcross population [J]. Crop Sci., 2005, 45:1114-1119. |
| 6 | PATERSON A H, SARANGA Y, MENZ M, et al.. QTL analysis of genotype × environment interactions affecting cotton fiber quality [J]. Theor. Appl. Genet., 2003, 106(3): 384-396. |
| 7 | WILKINS T A, ARPAT A B. The cotton fiber transcriptome [J]. Physiol. Plan., 2005, 124(3): 295-300. |
| 8 | PATERSON A H, Damon S, Hewitt J D, et al.. Mendelian factors underlying quantitative traits in tomato: comparison across species generations and environments [J]. Genetics, 1991,127: 181-197. |
| 9 | SHEN X, GUO W, LU Q, et al.. Genetic mapping of quantitative trait loci for fiber quality and yield trait by RIL approach in Upland cotton [J]. BMC Genomics, 2007, 155(3): 371-380. |
| 10 | TAN Z Y, FANG X M, TANG S Y, et al.. Genetic map and QTL controlling fiber quality traits in upland cotton (Gossypium hirsutum L.) [J]. Euphytica, 2015, 203:615-628. |
| 11 | FANG X, LIU X, WANG X, et al.. Fine-mapping qFS07.1 controlling fiber strength in upland cotton (Gossypium hirsutum L.) [J]. Theor. Appl. Genet., 2017, 130(4): 795-806. |
| 12 | SU C F, WANG W, QIU X M, et al.. Fine-mapping a fiber strength QTL QFS-D11-1 on cotton chromosome 21 using introgressed lines [J]. Plant Breeding, 2013, 132:725-730. |
| 13 | ZHANG T, YUAN Y, YU J, et al.. Molecular tagging of a major QTL for fiber strength in upland cotton and its marker-assisted selection [J]. Theor. Appl. Genet., 2003, 106(2): 262-268. |
| 14 | 袁有禄,张天真,郭旺珍,等.棉花高品质纤维性状QTLs的分子标记筛选及其定位[J].遗传学报,2001, 28(12):1151-1161. |
| YUAN Y L, ZHANG T Z, GUO W Z, et al.. Screening and mapping of molecular markers for QTLs of high quality cotton fiber traits [J]. Acta Genetica Sinica, 2001, 28(12):1151-1161. | |
| 15 | ZHANG Z, SHANG H, SHI Y, et al.. Construction of a high-density genetic map by specific locus amplified fragment sequencing (SLAF-seq) and its application to quantitative trait loci (QTL) analysis for boll weight in upland cotton (Gossypium hirsutum) [J/OL]. BMC Plant Biol., 2016, 16:79 [2022-11-28]. . |
| 16 | GANAL M W, ALTMANN T, RÖDER M S. SNP identification in crop plants [J]. Curr. Opin. Plant Biol., 2009, 12(2): 211-217. |
| 17 | ZHANG Z, GE Q, LIU A, et al.. Construction of a high-density genetic map and its application to QTL identification for fiber strength in upland cotton [J]. Crop Sci., 2017, 57(2): 774-788. |
| 18 | MA Z, HE S, WANG X, et al.. Resequencing a core collection of upland cotton identifies genomic variation and loci influencing fiber quality and yield [J]. Nat. Genet., 2018, 50(6): 803-813. |
| 19 | FANG L, WANG Q, HU Y, et al.. Genomic analyses in cotton identify signatures of selection and loci associated with fiber quality and yield traits [J]. Nat. Genet., 2017, 49(7): 1089-1098. |
| 20 | LI C, FU Y, SUN R, et al.. Single-locus and multi-locus genome-wide association studies in the genetic dissection of fiber quality traits in upland cotton (Gossypium hirsutum L.) [J/OL]. Front. Plant Sci., 2018, 9:1083 [2022-10-05]. . |
| 21 | LI P, SU T, WANG H, et al.. Development of a core set of KASP markers for assaying genetic diversity in Brassica rapa subsp. chinensis Makino [J]. Plant Breeding, 2019, 138(3): 309-324. |
| 22 | YANG G, CHEN S, CHEN L, et al.. Development of a core SNP arrays based on the KASP method for molecular breeding of rice [J]. Rice, 2019, 12(1): 1-18. |
| 23 | CHANDRA S, SINGH D, PATHAK J, et al.. SNP discovery from next-generation transcriptome sequencing data and their validation using KASP assay in wheat (Triticum aestivum L.) [J]. Mol. Breeding, 2017, 37(7): 1-15. |
| 24 | OBENG-BIO E, BADU-APRAKU B, ELORHOR IFIE B, et al.. Phenotypic characterization and validation of provitamin A functional genes in early maturing provitamin a-quality protein maize (Zea mays) inbred lines [J]. Plant Breeding, 2020, 139(3): 575-588. |
| 25 | ZHANG J, STEWART J. Economical and rapid method for extracting cotton genomic DNA [J]. Cotton Sci., 2000, 4(3): 193-201. |
| 26 | ZHANG T, HU Y, JIANG W, et al.. Sequencing of allotetraploid cotton (Gossypium hirsutum L. acc. TM-1) provides a resource for fiber improvement [J]. Nat. Biotechnol., 2015, 33(5): 531-537. |
| 27 | ZILL P, BUTTNER A, EISENMENGER W, et al.. Single nucleotide polymorphism and haplotype analysis of a novel tryptophan hydroxylase isoform (TPH2) gene in suicide victims [J]. Biol. Psychiat., 2004, 56(8):581-586. |
| 28 | KUMP K L, BRADBURY P J, WISSER R J, et al.. Genome-wide association study of quantitative resistance to southern leaf blight in the maize nested association mapping population [J]. Nat. Genet., 2011, 43(2): 163-168. |
| 29 | WANG X, WANG H, LIU S, et al.. Genetic variation in ZmVPP1 contributes to drought tolerance in maize seedlings [J]. Nat. Genet., 2016, 48(10): 1233-1241. |
| 30 | HUANG X, SANG T, ZHAO Q, et al.. Genome-wide association studies of 14 agronomic traits in rice landraces [J]. Nat. Genet., 2010, 42(11): 961-967. |
| 31 | BAGGE M, XIA X, LÜBBERSTEDT T. Functional markers in wheat [J]. Curr. Opin. Plant Biol., 2007, 10(2): 211-216. |
| 32 | PERUMALSAMY S, BHARANI M, SUDHA M, et al.. Functional marker-assisted selection for bacterial leaf blight resistance genes in rice (Oryza sativa L.). [J]. Plant Breeding, 2010, 129(4): 400-406. |
| 33 | LIU Y, WANG F, ZHANG A, et al.. Development and validation of functional markers (tetra-primer ARMS and KASP) for the bacterial blight resistance gene xa5 in rice [J]. Plant Pathol., 2021, 50(3): 323-327. |
| 34 | FANG T, LEI L, LI G, et al.. Development and deployment of KASP markers for multiple alleles of Lr34 in wheat [J]. Theor. Appl. Genet., 2020, 133(7): 2183-2195. |
| 35 | RASHEED A, WEN W, GAO F, et al.. Development and validation of KASP assays for genes underpinning key economic traits in bread wheat [J]. Theor. Appl. Genet., 2016, 129(10): 1843-1860. |
| 36 | AKEY J, JIN L, XIONG M. Haplotypes vs single marker linkage disequilibrium tests: what do we gain? [J]. Eu. J. Hum. Gene., 2001, 9(4): 291-300. |
| 37 | DALY M J, RIOUX J D, SCHAFFNER S F, et al.. High-resolution haplotype structure in the human genome [J]. Nat. Genet., 2001, 29(2): 229-232. |
| 38 | MILLER P A, WILLIAMS Jr J C, ROBINSON H F, et al.. Estimates of genotypic and environmental variances and covariances in upland cotton and their implications in selection [J]. Agron. J., 1958, 50(3): 126-131. |
| 39 | LI F, FAN G, LU C, et al.. Genome sequence of cultivated Upland cotton (Gossypium hirsutum TM-1) provides insights into genome evolution [J]. Nat. Biotechnol., 2015, 33(5): 524-530. |
| 40 | SHEN X, GUO W, ZHU X, et al.. Molecular mapping of QTLs for fiber qualities in three diverse lines in upland cotton using SSR markers [J]. Mol. Breeding, 2005, 15(2): 169-181. |
| 41 | 潘家驹.棉花育种学[M]. 北京:中国农业出版社,1998:204. |
| PAN J. Cotton Breeding [M]. Beijing: China Agriculture Press, 1998:204. |
| [1] | 郑德有, 左东云, 王巧莲, 吕丽敏, 程海亮, 顾爱星, 宋国立. 氟节胺与杀菌剂复配防治棉花枯萎病的增效药剂筛选[J]. 中国农业科技导报, 2024, 26(1): 119-124. |
| [2] | 王为, 赵强, 穆妮热·阿卜杜艾尼, 阿里木·阿木力null, 李欣欣, 田阳青. 烯效唑复配不同外源物质对棉花化学封顶及产量品质的影响[J]. 中国农业科技导报, 2023, 25(9): 57-68. |
| [3] | 孙正冉, 张翠萍, 张晋丽, 吴昊, 刘秀艳, 王振凯, 杨玉珍, 贺道华. 喷施化学打顶剂对关中棉区棉花植株生长的影响[J]. 中国农业科技导报, 2023, 25(4): 167-177. |
| [4] | 牛营超, 王星, 郭青云, 戴小华, 袁小勇, 陈琳. 棉花立枯病拮抗细菌的分离鉴定及抑菌活性[J]. 中国农业科技导报, 2023, 25(12): 138-144. |
| [5] | 杨文俊, 朱雨婷, 张杰, 徐凯祥, 韦聪敏, 陈全家. 棉花苗期耐盐相关性状QTL元分析[J]. 中国农业科技导报, 2023, 25(12): 26-34. |
| [6] | 陈炟, 巨吉生, 马麒, 徐守振, 刘娟娟, 袁文敏, 李吉莲, 王彩香, 宿俊吉. FeNPs对苗期棉花根系生长及其对干旱响应的影响[J]. 中国农业科技导报, 2023, 25(11): 49-57. |
| [7] | 张曼, 张进, 张新雨, 王国宁, 王省芬, 张艳. 陆地棉GhNAC1基因的克隆及抗黄萎病功能分析[J]. 中国农业科技导报, 2023, 25(10): 35-44. |
| [8] | 陆国清, 马彩霞, 孙国清, 郭惠明, 程红梅. 抗除草剂棉花GV-2的分子特征和遗传稳定性分析[J]. 中国农业科技导报, 2023, 25(1): 42-49. |
| [9] | 刘艳, 鲍红帅, 尚红燕, 王国宁, 张艳, 王省芬, 马峙英, 吴金华. 棉花枯萎病菌及其培养条件筛选[J]. 中国农业科技导报, 2022, 24(8): 124-132. |
| [10] | 刘海涛, 韩鑫, 兰玉彬, 伊丽丽, 王宝聚, 崔立华. 基于YOLOv4网络的棉花顶芽精准识别方法[J]. 中国农业科技导报, 2022, 24(8): 99-108. |
| [11] | 孙正文, 谷淇深, 张艳, 王省芬, 马峙英. 棉花基因发掘与分子育种研究进展[J]. 中国农业科技导报, 2022, 24(7): 32-38. |
| [12] | 闫成川, 曾庆涛, 陈琴, 付锦程, 王婷伟, 陈全家, 曲延英. 陆地棉花铃期抗旱指标筛选及评价[J]. 中国农业科技导报, 2022, 24(7): 46-57. |
| [13] | 吴楠, 杨君, 张艳, 孙正文, 张冬梅, 李丽花, 吴金华, 马峙英, 王省芬. 过表达棉花葡萄糖醛酸激酶基因GbGlcAK促进拟南芥细胞伸长[J]. 中国农业科技导报, 2022, 24(6): 36-46. |
| [14] | 黄雅婕, 任丹, 李生梅, 崔进鑫, 杨涛, 任姣姣, 高文伟. 陆地棉苗期的耐盐碱性评价及鉴定指标筛选[J]. 中国农业科技导报, 2022, 24(5): 46-55. |
| [15] | 周雨青, 杨永飞, 葛常伟, 沈倩, 张思平, 刘绍东, 马慧娟, 陈静, 刘瑞华, 李士丛, 赵新华, 李存东, 庞朝友. 基于WGCNA的棉花子叶抗冷相关共表达模块鉴定[J]. 中国农业科技导报, 2022, 24(4): 52-62. |
| 阅读次数 | ||||||
|
全文 |
|
|||||
|
摘要 |
|
|||||
 京公网安备11010802021197号